This is the multi-page printable view of this section. Click here to print.
Aggregation functions
- 1: covariance() (aggregation function)
- 2: covarianceif() (aggregation function)
- 3: covariancep() (aggregation function)
- 4: covariancepif() (aggregation function)
- 5: variancepif() (aggregation function)
- 6: Aggregation Functions
- 7: arg_max() (aggregation function)
- 8: arg_min() (aggregation function)
- 9: avg() (aggregation function)
- 10: avgif() (aggregation function)
- 11: binary_all_and() (aggregation function)
- 12: binary_all_or() (aggregation function)
- 13: binary_all_xor() (aggregation function)
- 14: buildschema() (aggregation function)
- 15: count_distinct() (aggregation function) - (preview)
- 16: count_distinctif() (aggregation function) - (preview)
- 17: count() (aggregation function)
- 18: countif() (aggregation function)
- 19: dcount() (aggregation function)
- 20: dcountif() (aggregation function)
- 21: hll_if() (aggregation function)
- 22: hll_merge() (aggregation function)
- 23: hll() (aggregation function)
- 24: make_bag_if() (aggregation function)
- 25: make_bag() (aggregation function)
- 26: make_list_if() (aggregation function)
- 27: make_list_with_nulls() (aggregation function)
- 28: make_list() (aggregation function)
- 29: make_set_if() (aggregation function)
- 30: make_set() (aggregation function)
- 31: max() (aggregation function)
- 32: maxif() (aggregation function)
- 33: min() (aggregation function)
- 34: minif() (aggregation function)
- 35: percentile(), percentiles()
- 36: percentilew(), percentilesw()
- 37: stdev() (aggregation function)
- 38: stdevif() (aggregation function)
- 39: stdevp() (aggregation function)
- 40: sum() (aggregation function)
- 41: sumif() (aggregation function)
- 42: take_any() (aggregation function)
- 43: take_anyif() (aggregation function)
- 44: tdigest_merge() (aggregation functions)
- 45: tdigest() (aggregation function)
- 46: variance() (aggregation function)
- 47: varianceif() (aggregation function)
- 48: variancep() (aggregation function)
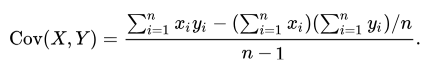
1 - covariance() (aggregation function)
Calculates the sample covariance of two random variables expr1 and expr2.
The following formula is used:
Syntax
covariance(expr1 , *expr2 )
Parameters
| Name | Type | Required | Description |
|---|---|---|---|
| expr1 | real | ✔️ | First random variable expression. |
| expr2 | real | ✔️ | Second random variable expression. |
Returns
Returns the covariance value of expr1 and expr2.
Examples
The example in this section shows how to use the syntax to help you get started.
datatable(x:real, y:real) [
    1.0, 14.0,
    2.0, 10.0,
    3.0, 17.0,
    4.0, 20.0,
    5.0, 50.0,
]
| summarize covariance(x, y)
Output
| covariance_x_y | |
|---|---|
| 20.5 |
2 - covarianceif() (aggregation function)
Calculates the sample covariance of two random variables expr1 and expr2 in records for which predicate evaluates to true.
The following formula is used:
Syntax
covarianceif(expr1 , *expr2 , predicate)
Parameters
| Name | Type | Required | Description |
|---|---|---|---|
| expr1 | real | ✔️ | First random variable expression. |
| expr2 | real | ✔️ | Second random variable expression. |
| predicate | string | ✔️ | If predicate evaluates to true, values of expr1 and expr2 will be added to the covariance. |
Returns
Returns the covariance value of expr1 and expr2 in records for which predicate evaluates to true.
Example
The example in this section shows how to use the syntax to help you get started.
This query calculates the covariance of x and y for the subset of numbers where x is divisible by 3.
range x from 1 to 100 step 1
| extend y = iff(x % 2 == 0, x * 2, x * 3)
| summarize covarianceif(x, y, x % 3 == 0)
Output
| covarianceif_x_y | |
|---|---|
| 2142 |
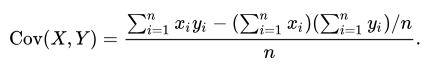
3 - covariancep() (aggregation function)
Calculates the population covariance of two random variables expr1 and expr2.
The following formula is used:
Syntax
covariancep(expr1 , expr2 )
Parameters
| Name | Type | Required | Description |
|---|---|---|---|
| expr1 | real | ✔️ | First random variable expression. |
| expr2 | real | ✔️ | Second random variable expression. |
Returns
Returns the covariance value of expr1 and expr2.
Examples
The example in this section shows how to use the syntax to help you get started.
datatable(x:real, y:real) [
    1.0, 14.0,
    2.0, 10.0,
    3.0, 17.0,
    4.0, 20.0,
    5.0, 50.0,
]
| summarize covariancep(x, y)
Output
| covariancep_x_y | |
|---|---|
| 16.4 |
4 - covariancepif() (aggregation function)
Calculates the sample covariance of two random variables expr1 and expr2 in records for which predicate evaluates to true.
The following formula is used:
Syntax
covariancepif(expr1 , *expr2 , predicate)
Parameters
| Name | Type | Required | Description |
|---|---|---|---|
| expr1 | real | ✔️ | First random variable expression. |
| expr2 | real | ✔️ | Second random variable expression. |
| predicate | string | ✔️ | If predicate evaluates to true, values of expr1 and expr2 will be added to the covariance. |
Returns
Returns the covariance value of expr1 and expr2 in records for which predicate evaluates to true.
Example
The example in this section shows how to use the syntax to help you get started.
This query creates a new variable y based on whether x is even or odd and then calculates the covariance of x and y for the subset of numbers where x is divisible by 3.
range x from 1 to 100 step 1
| extend y = iff(x % 2 == 0, x * 2, x * 3)
| summarize covariancepif(x, y, x % 3 == 0)
Output
| covariancepif_x_y | |
|---|---|
| 2077.09090909091 |
5 - variancepif() (aggregation function)
Calculates the variance of expr in records for which predicate evaluates to true.
Syntax
variancepif(expr, predicate)
Parameters
| Name | Type | Required | Description |
|---|---|---|---|
| expr | string | ✔️ | The expression to use for the variance calculation. |
| predicate | string | ✔️ | If predicate evaluates to true, the expr calculated value will be added to the variance. |
Returns
Returns the variance value of expr in records for which predicate evaluates to true.
Example
This query generates a sequence of numbers from 1 to 100 and then calculates the variance of the even numbers within that sequence.
range x from 1 to 100 step 1
| summarize variancepif(x, x%2 == 0)
Output
| variancepif_x |
|---|
| 850 |
6 - Aggregation Functions
An aggregation function performs a calculation on a set of values, and returns a single value. These functions are used in conjunction with the summarize operator. This article lists all available aggregation functions grouped by type. For scalar functions, see Scalar function types.
Binary functions
| Function Name | Description |
|---|---|
| binary_all_and() | Returns aggregated value using the binary AND of the group. |
| binary_all_or() | Returns aggregated value using the binary OR of the group. |
| binary_all_xor() | Returns aggregated value using the binary XOR of the group. |
Dynamic functions
| Function Name | Description |
|---|---|
| buildschema() | Returns the minimal schema that admits all values of the dynamic input. |
| make_bag(), make_bag_if() | Returns a property bag of dynamic values within the group without/with a predicate. |
| make_list(), make_list_if() | Returns a list of all the values within the group without/with a predicate. |
| make_list_with_nulls() | Returns a list of all the values within the group, including null values. |
| make_set(), make_set_if() | Returns a set of distinct values within the group without/with a predicate. |
Row selector functions
| Function Name | Description |
|---|---|
| arg_max() | Returns one or more expressions when the argument is maximized. |
| arg_min() | Returns one or more expressions when the argument is minimized. |
| take_any(), take_anyif() | Returns a random non-empty value for the group without/with a predicate. |
Statistical functions
| Function Name | Description |
|---|---|
| avg() | Returns an average value across the group. |
| avgif() | Returns an average value across the group (with predicate). |
| count(), countif() | Returns a count of the group without/with a predicate. |
| count_distinct(), count_distinctif() | Returns a count of unique elements in the group without/with a predicate. |
| dcount(), dcountif() | Returns an approximate distinct count of the group elements without/with a predicate. |
| hll() | Returns the HyperLogLog (HLL) results of the group elements, an intermediate value of the dcount approximation. |
| hll_if() | Returns the HyperLogLog (HLL) results of the group elements, an intermediate value of the dcount approximation (with predicate). |
| hll_merge() | Returns a value for merged HLL results. |
| max(), maxif() | Returns the maximum value across the group without/with a predicate. |
| min(), minif() | Returns the minimum value across the group without/with a predicate. |
| percentile() | Returns a percentile estimation of the group. |
| percentiles() | Returns percentile estimations of the group. |
| percentiles_array() | Returns the percentile approximates of the array. |
| percentilesw() | Returns the weighted percentile approximate of the group. |
| percentilesw_array() | Returns the weighted percentile approximate of the array. |
| stdev(), stdevif() | Returns the standard deviation across the group for a population that is considered a sample without/with a predicate. |
| stdevp() | Returns the standard deviation across the group for a population that is considered representative. |
| sum(), sumif() | Returns the sum of the elements within the group without/with a predicate. |
| tdigest() | Returns an intermediate result for the percentiles approximation, the weighted percentile approximate of the group. |
| tdigest_merge() | Returns the merged tdigest value across the group. |
| variance(), varianceif() | Returns the variance across the group without/with a predicate. |
| variancep(), variancepif() | Returns the variance across the group for a population that is considered representative. |
7 - arg_max() (aggregation function)
Finds a row in the table that maximizes the specified expression. It returns all columns of the input table or specified columns.
Syntax
arg_max (ExprToMaximize, * | ExprToReturn [, …])
Parameters
| Name | Type | Required | Description |
|---|---|---|---|
| ExprToMaximize | string | ✔️ | The expression for which the maximum value is determined. |
| ExprToReturn | string | ✔️ | The expression determines which columns’ values are returned, from the row that has the maximum value for ExprToMaximize. Use a wildcard * to return all columns. |
Returns
Returns a row in the table that maximizes the specified expression ExprToMaximize, and the values of columns specified in ExprToReturn.
Examples
General examples
The following example finds the maximum latitude of a storm event in each state.
StormEvents
| summarize arg_max(BeginLat, BeginLocation) by State
Output
The results table displays only the first 10 rows.
| State | BeginLat | BeginLocation |
|---|---|---|
| MISSISSIPPI | 34.97 | BARTON |
| VERMONT | 45 | NORTH TROY |
| AMERICAN SAMOA | -14.2 | OFU |
| HAWAII | 22.2113 | PRINCEVILLE |
| MINNESOTA | 49.35 | ARNESEN |
| RHODE ISLAND | 42 | WOONSOCKET |
| INDIANA | 41.73 | FREMONT |
| WEST VIRGINIA | 40.62 | CHESTER |
| SOUTH CAROLINA | 35.18 | LANDRUM |
| TEXAS | 36.4607 | DARROUZETT |
| … | … | … |
The following example finds the last time an event with a direct death happened in each state, showing all the columns.
The query first filters the events to include only those events where there was at least one direct death. Then the query returns the entire row with the most recent StartTime.
StormEvents
| where DeathsDirect > 0
| summarize arg_max(StartTime, *) by State
Output
The results table displays only the first 10 rows and first three columns.
| State | StartTime | EndTime | … |
|---|---|---|---|
| GUAM | 2007-01-27T11:15:00Z | 2007-01-27T11:30:00Z | … |
| MASSACHUSETTS | 2007-02-03T22:00:00Z | 2007-02-04T10:00:00Z | … |
| AMERICAN SAMOA | 2007-02-17T13:00:00Z | 2007-02-18T11:00:00Z | … |
| IDAHO | 2007-02-17T13:00:00Z | 2007-02-17T15:00:00Z | … |
| DELAWARE | 2007-02-25T13:00:00Z | 2007-02-26T01:00:00Z | … |
| WYOMING | 2007-03-10T17:00:00Z | 2007-03-10T17:00:00Z | … |
| NEW MEXICO | 2007-03-23T18:42:00Z | 2007-03-23T19:06:00Z | … |
| INDIANA | 2007-05-15T14:14:00Z | 2007-05-15T14:14:00Z | … |
| MONTANA | 2007-05-18T14:20:00Z | 2007-05-18T14:20:00Z | … |
| LAKE MICHIGAN | 2007-06-07T13:00:00Z | 2007-06-07T13:00:00Z | … |
| … | … | … | … |
The following example demonstrates null handling.
datatable(Fruit: string, Color: string, Version: int) [
    "Apple", "Red", 1,
    "Apple", "Green", int(null),
    "Banana", "Yellow", int(null),
    "Banana", "Green", int(null),
    "Pear", "Brown", 1,
    "Pear", "Green", 2,
]
| summarize arg_max(Version, *) by Fruit
Output
| Fruit | Version | Color |
|---|---|---|
| Apple | 1 | Red |
| Banana | Yellow | |
| Pear | 2 | Green |
Examples comparing arg_max() and max()
The arg_max() function differs from the max() function. The arg_max() function allows you to return other columns along with the maximum value, and max() only returns the maximum value itself.
The following example uses arg_max() to find the last time an event with a direct death happened in each state, showing all the columns. The query first filters the events to only include events where there was at least one direct death. Then the query returns the entire row with the most recent (maximum) StartTime.
StormEvents
| where DeathsDirect > 0
| summarize arg_max(StartTime, *)
The results table returns all the columns for the row containing the highest value in the expression specified.
| StartTime | EndTime | EpisodeId | EventId | State | EventType | … | |–|–|–|–| | 2007-12-31T15:00:00Z | 2007-12-31T15:00:00 | 12688 | 69700 | UTAH | Avalanche | … |
The following example uses the max() function to find the last time an event with a direct death happened in each state, but only returns the maximum value of StartTime.
StormEvents
| where DeathsDirect > 0
| summarize max(StartTime)
The results table returns the maximum value of StartTime, without returning other columns for this record.
| max_StartTime |
|---|
| 2007-12-31T15:00:00Z |
Related content
8 - arg_min() (aggregation function)
Finds a row in the table that minimizes the specified expression. It returns all columns of the input table or specified columns.
Syntax
arg_min (ExprToMinimize, * | ExprToReturn [, …])
Parameters
| Name | Type | Required | Description |
|---|---|---|---|
| ExprToMinimize | string | ✔️ | The expression for which the minimum value is determined. |
| ExprToReturn | string | ✔️ | The expression determines which columns’ values are returned, from the row that has the minimum value for ExprToMinimize. Use a wildcard * to return all columns. |
Null handling
When ExprToMinimize is null for all rows in a table, one row in the table is picked. Otherwise, rows where ExprToMinimize is null are ignored.
Returns
Returns a row in the table that minimizes ExprToMinimize, and the values of columns specified in ExprToReturn. Use or * to return the entire row.
Examples
The following example finds the maximum latitude of a storm event in each state.
StormEvents
| summarize arg_min(BeginLat, BeginLocation) by State
Output
The results table shown includes only the first 10 rows.
| State | BeginLat | BeginLocation |
|---|---|---|
| AMERICAN SAMOA | -14.3 | PAGO PAGO |
| CALIFORNIA | 32.5709 | NESTOR |
| MINNESOTA | 43.5 | BIGELOW |
| WASHINGTON | 45.58 | WASHOUGAL |
| GEORGIA | 30.67 | FARGO |
| ILLINOIS | 37 | CAIRO |
| FLORIDA | 24.6611 | SUGARLOAF KEY |
| KENTUCKY | 36.5 | HAZEL |
| TEXAS | 25.92 | BROWNSVILLE |
| OHIO | 38.42 | SOUTH PT |
| … | … | … |
Find the first time an event with a direct death happened in each state, showing all of the columns.
The query first filters the events to only include those where there was at least one direct death. Then the query returns the entire row with the lowest value for StartTime.
StormEvents
| where DeathsDirect > 0
| summarize arg_min(StartTime, *) by State
Output
The results table shown includes only the first 10 rows and first 3 columns.
| State | StartTime | EndTime | … |
|---|---|---|---|
| INDIANA | 2007-01-01T00:00:00Z | 2007-01-22T18:49:00Z | … |
| FLORIDA | 2007-01-03T10:55:00Z | 2007-01-03T10:55:00Z | … |
| NEVADA | 2007-01-04T09:00:00Z | 2007-01-05T14:00:00Z | … |
| LOUISIANA | 2007-01-04T15:45:00Z | 2007-01-04T15:52:00Z | … |
| WASHINGTON | 2007-01-09T17:00:00Z | 2007-01-09T18:00:00Z | … |
| CALIFORNIA | 2007-01-11T22:00:00Z | 2007-01-24T10:00:00Z | … |
| OKLAHOMA | 2007-01-12T00:00:00Z | 2007-01-18T23:59:00Z | … |
| MISSOURI | 2007-01-13T03:00:00Z | 2007-01-13T08:30:00Z | … |
| TEXAS | 2007-01-13T10:30:00Z | 2007-01-13T14:30:00Z | … |
| ARKANSAS | 2007-01-14T03:00:00Z | 2007-01-14T03:00:00Z | … |
| … | … | … | … |
The following example demonstrates null handling.
datatable(Fruit: string, Color: string, Version: int) [
    "Apple", "Red", 1,
    "Apple", "Green", int(null),
    "Banana", "Yellow", int(null),
    "Banana", "Green", int(null),
    "Pear", "Brown", 1,
    "Pear", "Green", 2,
]
| summarize arg_min(Version, *) by Fruit
Output
| Fruit | Version | Color |
|---|---|---|
| Apple | 1 | Red |
| Banana | Yellow | |
| Pear | 1 | Brown |
Comparison to min()
The arg_min() function differs from the min() function. The arg_min() function allows you to return additional columns along with the minimum value, and min() only returns the minimum value itself.
Examples
The following example uses arg_min() to find the last time an event with a direct death happened in each state, showing all the columns.
StormEvents
| where DeathsDirect > 0
| summarize arg_min(StartTime, *)
The results table returns all the columns for the row containing the lowest value in the expression specified.
| StartTime | EndTime | EpisodeId | EventId | State | EventType | … | |–|–|–|–| | 2007-01-01T00:00:00Z | 2007-01-22T18:49:00Z | 2408 | 11929 | INDIANA | Flood | … |
The following example uses the min() function to find the last time an event with a direct death happened in each state, but only returns the minimum value of StartTime.
StormEvents
| where DeathsDirect > 0
| summarize min(StartTime)
The results table returns the lowest value in the specific column only.
| min_StartTime |
|---|
| 2007-01-01T00:00:00Z |
Related content
9 - avg() (aggregation function)
Calculates the average (arithmetic mean) of expr across the group.
Syntax
avg(expr)
Parameters
| Name | Type | Required | Description |
|---|---|---|---|
| expr | string | ✔️ | The expression used for aggregation calculation. Records with null values are ignored and not included in the calculation. |
Returns
Returns the average value of expr across the group.
Examples
The following example returns the average number of damaged crops per state.
StormEvents
| summarize AvgDamageToCrops = avg(DamageCrops) by State
The results table shown includes only the first 10 rows.
| State | AvgDamageToCrops |
|---|---|
| TEXAS | 7524.569241 |
| KANSAS | 15366.86671 |
| IOWA | 4332.477535 |
| ILLINOIS | 44568.00198 |
| MISSOURI | 340719.2212 |
| GEORGIA | 490702.5214 |
| MINNESOTA | 2835.991494 |
| WISCONSIN | 17764.37838 |
| NEBRASKA | 21366.36467 |
| NEW YORK | 5.714285714 |
| … | … |
Related content
10 - avgif() (aggregation function)
Calculates the average of expr in records for which predicate evaluates to true.
Syntax
avgif (expr, predicate)
Parameters
| Name | Type | Required | Description |
|---|---|---|---|
| expr | string | ✔️ | The expression used for aggregation calculation. Records with null values are ignored and not included in the calculation. |
| predicate | string | ✔️ | The predicate that if true, the expr calculated value is added to the average. |
Returns
Returns the average value of expr in records where predicate evaluates to true.
Examples
The following example calculates the average damage by state in cases where there was any damage.
StormEvents
| summarize Averagedamage=tolong(avg( DamageCrops)),AverageWhenDamage=tolong(avgif(DamageCrops,DamageCrops >0)) by State
Output
The results table shown includes only the first 10 rows.
| State | Averagedamage | Averagewhendamage |
|---|---|---|
| TEXAS | 7524 | 491291 |
| KANSAS | 15366 | 695021 |
| IOWA | 4332 | 28203 |
| ILLINOIS | 44568 | 2574757 |
| MISSOURI | 340719 | 8806281 |
| GEORGIA | 490702 | 57239005 |
| MINNESOTA | 2835 | 144175 |
| WISCONSIN | 17764 | 438188 |
| NEBRASKA | 21366 | 187726 |
| NEW YORK | 5 | 10000 |
| … | … | … |
Related content
11 - binary_all_and() (aggregation function)
Accumulates values using the binary AND operation for each summarization group, or in total if a group isn’t specified.
Syntax
binary_all_and (expr)
Parameters
| Name | Type | Required | Description |
|---|---|---|---|
| expr | long | ✔️ | The value used for the binary AND calculation. |
Returns
Returns an aggregated value using the binary AND operation over records for each summarization group, or in total if a group isn’t specified.
Examples
The following example produces CAFEF00D using binary AND operations.
datatable(num:long)
[
  0xFFFFFFFF,
  0xFFFFF00F,
  0xCFFFFFFD,
  0xFAFEFFFF,
]
| summarize result = toupper(tohex(binary_all_and(num)))
Output
| result |
|---|
| CAFEF00D |
Related content
12 - binary_all_or() (aggregation function)
Accumulates values using the binary OR operation for each summarization group, or in total if a group isn’t specified.
Syntax
binary_all_or (expr)
Parameters
| Name | Type | Required | Description |
|---|---|---|---|
| expr | long | ✔️ | The value used for the binary OR calculation. |
Returns
Returns an aggregated value using the binary OR operation over records for each summarization group, or in total if a group isn’t specified.
Examples
The following example produces CAFEF00D using binary OR operations.
datatable(num:long)
[
  0x88888008,
  0x42000000,
  0x00767000,
  0x00000005,
]
| summarize result = toupper(tohex(binary_all_or(num)))
Output
| result |
|---|
| CAFEF00D |
Related content
13 - binary_all_xor() (aggregation function)
Accumulates values using the binary XOR operation for each summarization group, or in total if a group is not specified.
Syntax
binary_all_xor (expr)
Parameters
| Name | Type | Required | Description |
|---|---|---|---|
| expr | long | ✔️ | The value used for the binary XOR calculation. |
Returns
Returns a value that is aggregated using the binary XOR operation over records for each summarization group, or in total if a group isn’t specified.
Examples
The following example produces CAFEF00D using binary XOR operations.
datatable(num:long)
[
  0x44404440,
  0x1E1E1E1E,
  0x90ABBA09,
  0x000B105A,
]
| summarize result = toupper(tohex(binary_all_xor(num)))
Output
| results |
|---|
| CAFEF00D |
Related content
14 - buildschema() (aggregation function)
Builds the minimal schema that admits all values of DynamicExpr.
Syntax
buildschema (DynamicExpr)
Parameters
| Name | Type | Required | Description |
|---|---|---|---|
| DynamicExpr | dynamic | ✔️ | Expression used for the aggregation calculation. |
Returns
Returns the minimal schema that admits all values of DynamicExpr.
Examples
The following example builds a schema based on:
{"x":1, "y":3.5}{"x":"somevalue", "z":[1, 2, 3]}{"y":{"w":"zzz"}, "t":["aa", "bb"], "z":["foo"]}
datatable(value: dynamic) [
    dynamic({"x":1, "y":3.5}),
    dynamic({"x":"somevalue", "z":[1, 2, 3]}),
    dynamic({"y":{"w":"zzz"}, "t":["aa", "bb"], "z":["foo"]})
]
| summarize buildschema(value)
Output
| schema_value |
|---|
{“x”:[“long”,“string”],“y”:[“double”,{“w”:“string”}],“z”:{"indexer":[“long”,“string”]},“t”:{"indexer":“string”}} |
Schema breakdown
In the resulting schema:
- The root object is a container with four properties named
x,y,z, andt. - Property
xis either type long or type string. - Property
yis either type double or another container with a propertywof type string. - Property
zis an array, indicated by theindexerkeyword, where each item can be either type long or type string. - Property
tis an array, indicated by theindexerkeyword, where each item is a string. - Every property is implicitly optional, and any array might be empty.
Related content
15 - count_distinct() (aggregation function) - (preview)
Counts unique values specified by the scalar expression per summary group, or the total number of unique values if the summary group is omitted.
If you only need an estimation of unique values count, we recommend using the less resource-consuming dcount aggregation function.
To count only records for which a predicate returns true, use the count_distinctif aggregation function.
Syntax
count_distinct (expr)
Parameters
| Name | Type | Required | Description |
|---|---|---|---|
| expr | scalar | ✔️ | The expression whose unique values are to be counted. |
Returns
Long integer value indicating the number of unique values of expr per summary group.
Examples
The following example shows how many types of storm events happened in each state.
Function performance can be degraded when operating on multiple data sources from different clusters.
StormEvents
| summarize UniqueEvents=count_distinct(EventType) by State
| top 5 by UniqueEvents
Output
| State | UniqueEvents |
|---|---|
| TEXAS | 27 |
| CALIFORNIA | 26 |
| PENNSYLVANIA | 25 |
| GEORGIA | 24 |
| NORTH CAROLINA | 23 |
Related content
16 - count_distinctif() (aggregation function) - (preview)
Conditionally counts unique values specified by the scalar expression per summary group, or the total number of unique values if the summary group is omitted. Only records for which predicate evaluates to true are counted.
If you only need an estimation of unique values count, we recommend using the less resource-consuming dcountif aggregation function.
Syntax
count_distinctif (expr, predicate)
Parameters
| Name | Type | Required | Description |
|---|---|---|---|
| expr | scalar | ✔️ | The expression whose unique values are to be counted. |
| predicate | string | ✔️ | The expression used to filter records to be aggregated. |
Returns
Integer value indicating the number of unique values of expr per summary group, for all records for which the predicate evaluates to true.
Examples
The following example shows how many types of death-causing storm events happened in each state. Only storm events with a nonzero count of deaths are counted.
StormEvents
| summarize UniqueFatalEvents=count_distinctif(EventType,(DeathsDirect + DeathsIndirect)>0) by State
| where UniqueFatalEvents > 0
| top 5 by UniqueFatalEvents
Output
| State | UniqueFatalEvents |
|---|---|
| TEXAS | 12 |
| CALIFORNIA | 12 |
| OKLAHOMA | 10 |
| NEW YORK | 9 |
| KANSAS | 9 |
Related content
17 - count() (aggregation function)
Counts the number of records per summarization group, or total if summarization is done without grouping.
To only count records for which a predicate returns true, use countif().
Syntax
count()
Returns
Returns a count of the records per summarization group, or in total if summarization is done without grouping.
Examples
The following example returns a count of events in states:
StormEvents
| summarize Count=count() by State
Output
| State | Count |
|---|---|
| TEXAS | 4701 |
| KANSAS | 3166 |
| IOWA | 2337 |
| ILLINOIS | 2022 |
| MISSOURI | 2016 |
| GEORGIA | 1983 |
| MINNESOTA | 1881 |
| WISCONSIN | 1850 |
| NEBRASKA | 1766 |
| NEW YORK | 1750 |
| … | … |
Related content
18 - countif() (aggregation function)
Counts the rows in which predicate evaluates to true.
Syntax
countif (predicate)
Parameters
| Name | Type | Required | Description |
|---|---|---|---|
| predicate | string | ✔️ | The expression used for aggregation calculation. The value can be any scalar expression with a return type of bool. |
Returns
Returns a count of rows in which predicate evaluates to true.
Examples
Count storms by state
This example shows the number of storms with damage to crops by state.
StormEvents
| summarize TotalCount=count(),TotalWithDamage=countif(DamageCrops >0) by State
The results table shown includes only the first 10 rows.
| State | TotalCount | TotalWithDamage |
|---|---|---|
| TEXAS | 4701 | 72 |
| KANSAS | 3166 | 70 |
| IOWA | 2337 | 359 |
| ILLINOIS | 2022 | 35 |
| MISSOURI | 2016 | 78 |
| GEORGIA | 1983 | 17 |
| MINNESOTA | 1881 | 37 |
| WISCONSIN | 1850 | 75 |
| NEBRASKA | 1766 | 201 |
| NEW YORK | 1750 | 1 |
| … | … | … |
Count based on string length
This example shows the number of names with more than four letters.
let T = datatable(name:string, day_of_birth:long)
[
   "John", 9,
   "Paul", 18,
   "George", 25,
   "Ringo", 7
];
T
| summarize countif(strlen(name) > 4)
Output
| countif_ |
|---|
| 2 |
Related content
19 - dcount() (aggregation function)
Calculates an estimate of the number of distinct values that are taken by a scalar expression in the summary group.
Syntax
dcount (expr[, accuracy])
Parameters
| Name | Type | Required | Description |
|---|---|---|---|
| expr | string | ✔️ | The input whose distinct values are to be counted. |
| accuracy | int | The value that defines the requested estimation accuracy. The default value is 1. See Estimation accuracy for supported values. |
Returns
Returns an estimate of the number of distinct values of expr in the group.
Examples
The following example shows how many types of storm events happened in each state.
StormEvents
| summarize DifferentEvents=dcount(EventType) by State
| order by DifferentEvents
The results table shown includes only the first 10 rows.
| State | DifferentEvents |
|---|---|
| TEXAS | 27 |
| CALIFORNIA | 26 |
| PENNSYLVANIA | 25 |
| GEORGIA | 24 |
| ILLINOIS | 23 |
| MARYLAND | 23 |
| NORTH CAROLINA | 23 |
| MICHIGAN | 22 |
| FLORIDA | 22 |
| OREGON | 21 |
| KANSAS | 21 |
| … | … |
Estimation accuracy
Related content
20 - dcountif() (aggregation function)
Estimates the number of distinct values of expr for rows in which predicate evaluates to true.
Syntax
dcountif (expr, predicate, [, accuracy])
Parameters
| Name | Type | Required | Description |
|---|---|---|---|
| expr | string | ✔️ | The expression used for the aggregation calculation. |
| predicate | string | ✔️ | The expression used to filter rows. |
| accuracy | int | The control between speed and accuracy. If unspecified, the default value is 1. See Estimation accuracy for supported values. |
Returns
Returns an estimate of the number of distinct values of expr for rows in which predicate evaluates to true.
Examples
The following example shows how many types of fatal storm events happened in each state.
StormEvents
| summarize DifferentFatalEvents=dcountif(EventType,(DeathsDirect + DeathsIndirect)>0) by State
| where DifferentFatalEvents > 0
| order by DifferentFatalEvents
The results table shown includes only the first 10 rows.
| State | DifferentFatalEvents |
|---|---|
| CALIFORNIA | 12 |
| TEXAS | 12 |
| OKLAHOMA | 10 |
| ILLINOIS | 9 |
| KANSAS | 9 |
| NEW YORK | 9 |
| NEW JERSEY | 7 |
| WASHINGTON | 7 |
| MICHIGAN | 7 |
| MISSOURI | 7 |
| … | … |
Estimation accuracy
Related content
21 - hll_if() (aggregation function)
Calculates the intermediate results of dcount in records for which the predicate evaluates to true.
Read about the underlying algorithm (HyperLogLog) and the estimation accuracy.
Syntax
hll_if (expr, predicate [, accuracy])
Parameters
| Name | Type | Required | Description |
|---|---|---|---|
| expr | string | ✔️ | The expression used for the aggregation calculation. |
| predicate | string | ✔️ | The Expr used to filter records to add to the intermediate result of dcount. |
| accuracy | int | The value that controls the balance between speed and accuracy. If unspecified, the default value is 1. For supported values, see Estimation accuracy. |
Returns
Returns the intermediate results of distinct count of Expr for which Predicate evaluates to true.
Examples
The following query results in the number of unique flood event sources in Iowa and Kansas. It uses the hll_if() function to show only flood events.
StormEvents
| where State in ("IOWA", "KANSAS")
| summarize hll_flood = hll_if(Source, EventType == "Flood") by State
| project State, SourcesOfFloodEvents = dcount_hll(hll_flood)
Output
| State | SourcesOfFloodEvents |
|---|---|
| KANSAS | 11 |
| IOWA | 7 |
Estimation accuracy
| Accuracy | Speed | Error (%) | |
|---|---|---|---|
| 0 | Fastest | 1.6 | |
| 1 | Balanced | 0.8 | |
| 2 | Slow | 0.4 | |
| 3 | Slow | 0.28 | |
| 4 | Slowest | 0.2 |
Related content
22 - hll_merge() (aggregation function)
Merges HLL results across the group into a single HLL value.
For more information, see the underlying algorithm (HyperLogLog) and estimation accuracy.
Syntax
hll_merge (hll)
Parameters
| Name | Type | Required | Description |
|---|---|---|---|
| hll | string | ✔️ | The column name containing HLL values to merge. |
Returns
The function returns the merged HLL values of hll across the group.
Example
The following example shows HLL results across a group merged into a single HLL value.
StormEvents
| summarize hllRes = hll(DamageProperty) by bin(StartTime,10m)
| summarize hllMerged = hll_merge(hllRes)
Output
The results show only the first five results in the array.
| hllMerged |
|---|
| [[1024,14],["-6903255281122589438","-7413697181929588220","-2396604341988936699",“5824198135224880646”,"-6257421034880415225", …],[]] |
Estimation accuracy
Related content
23 - hll() (aggregation function)
The hll() function is a way to estimate the number of unique values in a set of values. It does so by calculating intermediate results for aggregation within the summarize operator for a group of data using the dcount function.
Read about the underlying algorithm (HyperLogLog) and the estimation accuracy.
Syntax
hll (expr [, accuracy])
Parameters
| Name | Type | Required | Description |
|---|---|---|---|
| expr | string | ✔️ | The expression used for the aggregation calculation. |
| accuracy | int | The value that controls the balance between speed and accuracy. If unspecified, the default value is 1. For supported values, see Estimation accuracy. |
Returns
Returns the intermediate results of distinct count of expr across the group.
Example
In the following example, the hll() function is used to estimate the number of unique values of the DamageProperty column within each 10-minute time bin of the StartTime column.
StormEvents
| summarize hll(DamageProperty) by bin(StartTime,10m)
Output
The results table shown includes only the first 10 rows.
| StartTime | hll_DamageProperty |
|---|---|
| 2007-01-01T00:20:00Z | [[1024,14],[“3803688792395291579”],[]] |
| 2007-01-01T01:00:00Z | [[1024,14],[“7755241107725382121”,"-5665157283053373866",“3803688792395291579”,"-1003235211361077779"],[]] |
| 2007-01-01T02:00:00Z | [[1024,14],["-1003235211361077779","-5665157283053373866",“7755241107725382121”],[]] |
| 2007-01-01T02:20:00Z | [[1024,14],[“7755241107725382121”],[]] |
| 2007-01-01T03:30:00Z | [[1024,14],[“3803688792395291579”],[]] |
| 2007-01-01T03:40:00Z | [[1024,14],["-5665157283053373866"],[]] |
| 2007-01-01T04:30:00Z | [[1024,14],[“3803688792395291579”],[]] |
| 2007-01-01T05:30:00Z | [[1024,14],[“3803688792395291579”],[]] |
| 2007-01-01T06:30:00Z | [[1024,14],[“1589522558235929902”],[]] |
Estimation accuracy
Related content
24 - make_bag_if() (aggregation function)
Creates a dynamic JSON property bag (dictionary) of expr values in records for which predicate evaluates to true.
Syntax
make_bag_if(expr, predicate [, maxSize])
Parameters
| Name | Type | Required | Description |
|---|---|---|---|
| expr | dynamic | ✔️ | The expression used for the aggregation calculation. |
| predicate | bool | ✔️ | The predicate that evaluates to true, in order for expr to be added to the result. |
| maxSize | int | The limit on the maximum number of elements returned. The default and max value is 1048576. |
Returns
Returns a dynamic JSON property bag (dictionary) of expr values in records for which predicate evaluates to true. Nondictionary values are skipped.
If a key appears in more than one row, an arbitrary value, out of the possible values for this key, are selected.
Example
The following example shows a packed JSON property bag.
let T = datatable(prop:string, value:string, predicate:bool)
[
    "prop01", "val_a", true,
    "prop02", "val_b", false,
    "prop03", "val_c", true
];
T
| extend p = bag_pack(prop, value)
| summarize dict=make_bag_if(p, predicate)
Output
| dict |
|---|
| { “prop01”: “val_a”, “prop03”: “val_c” } |
Use bag_unpack() plugin for transforming the bag keys in the make_bag_if() output into columns.
let T = datatable(prop:string, value:string, predicate:bool)
[
    "prop01", "val_a", true,
    "prop02", "val_b", false,
    "prop03", "val_c", true
];
T
| extend p = bag_pack(prop, value)
| summarize bag=make_bag_if(p, predicate)
| evaluate bag_unpack(bag)
Output
| prop01 | prop03 |
|---|---|
| val_a | val_c |
Related content
25 - make_bag() (aggregation function)
Creates a dynamic JSON property bag (dictionary) of all the values of expr in the group.
Syntax
make_bag (expr [, maxSize])
Parameters
| Name | Type | Required | Description |
|---|---|---|---|
| expr | dynamic | ✔️ | The expression used for the aggregation calculation. |
| maxSize | int | The limit on the maximum number of elements returned. The default and max value is 1048576. |
Returns
Returns a dynamic JSON property bag (dictionary) of all the values of Expr in the group, which are property bags. Nondictionary values are skipped.
If a key appears in more than one row, an arbitrary value, out of the possible values for this key, is selected.
Example
The following example shows a packed JSON property bag.
let T = datatable(prop:string, value:string)
[
    "prop01", "val_a",
    "prop02", "val_b",
    "prop03", "val_c",
];
T
| extend p = bag_pack(prop, value)
| summarize dict=make_bag(p)
Output
| dict |
|---|
| { “prop01”: “val_a”, “prop02”: “val_b”, “prop03”: “val_c” } |
Use the bag_unpack() plugin for transforming the bag keys in the make_bag() output into columns.
let T = datatable(prop:string, value:string)
[
    "prop01", "val_a",
    "prop02", "val_b",
    "prop03", "val_c",
];
T
| extend p = bag_pack(prop, value)
| summarize bag=make_bag(p)
| evaluate bag_unpack(bag)
Output
| prop01 | prop02 | prop03 |
|---|---|---|
| val_a | val_b | val_c |
Related content
26 - make_list_if() (aggregation function)
Creates a dynamic array of expr values in the group for which predicate evaluates to true.
Syntax
make_list_if(expr, predicate [, maxSize])
Parameters
| Name | Type | Required | Description |
|---|---|---|---|
| expr | string | ✔️ | The expression used for the aggregation calculation. |
| predicate | string | ✔️ | A predicate that has to evaluate to true in order for expr to be added to the result. |
| maxSize | integer | The maximum number of elements returned. The default and max value is 1048576. |
Returns
Returns a dynamic array of expr values in the group for which predicate evaluates to true.
If the input to the summarize operator isn’t sorted, the order of elements in the resulting array is undefined.
If the input to the summarize operator is sorted, the order of elements in the resulting array tracks that of the input.
Example
The following example shows a list of names with more than 4 letters.
let T = datatable(name:string, day_of_birth:long)
[
   "John", 9,
   "Paul", 18,
   "George", 25,
   "Ringo", 7
];
T
| summarize make_list_if(name, strlen(name) > 4)
Output
| list_name |
|---|
| [“George”, “Ringo”] |
Related content
27 - make_list_with_nulls() (aggregation function)
dynamic JSON object (array) which includes null values.Creates a dynamic array of all the values of expr in the group, including null values.
Syntax
make_list_with_nulls(expr)
Parameters
| Name | Type | Required | Description |
|---|---|---|---|
| expr | string | ✔️ | The expression that to use to create the array. |
Returns
Returns a dynamic JSON object (array) of all the values of expr in the group, including null values.
If the input to the summarize operator isn’t sorted, the order of elements in the resulting array is undefined.
If the input to the summarize operator is sorted, the order of elements in the resulting array tracks that of the input.
Example
The following example shows null values in the results.
let shapes = datatable (name:string , sideCount: int)
[
    "triangle", int(null),
    "square", 4,
    "rectangle", 4,
    "pentagon", 5,
    "hexagon", 6,
    "heptagon", 7,
    "octagon", 8,
    "nonagon", 9,
    "decagon", 10
];
shapes
| summarize mylist = make_list_with_nulls(sideCount)
Output
| mylist |
|---|
| [null,4,4,5,6,7,8,9,10] |
28 - make_list() (aggregation function)
Creates a dynamic array of all the values of expr in the group.
Syntax
make_list(expr [, maxSize])
Parameters
| Name | Type | Required | Description |
|---|---|---|---|
| expr | dynamic | ✔️ | The expression used for the aggregation calculation. |
| maxSize | int | The maximum number of elements returned. The default and max value is 1048576. |
Returns
Returns a dynamic array of all the values of expr in the group.
If the input to the summarize operator isn’t sorted, the order of elements in the resulting array is undefined.
If the input to the summarize operator is sorted, the order of elements in the resulting array tracks that of the input.
Examples
The examples in this section show how to use the syntax to help you get started.
One column
The following example uses the datatable, shapes, to return a list of shapes in a single column.
let shapes = datatable (name: string, sideCount: int)
[
    "triangle", 3,
    "square", 4,
    "rectangle", 4,
    "pentagon", 5,
    "hexagon", 6,
    "heptagon", 7,
    "octagon", 8,
    "nonagon", 9,
    "decagon", 10
];
shapes
| summarize mylist = make_list(name)
Output
| mylist |
|---|
| [“triangle”,“square”,“rectangle”,“pentagon”,“hexagon”,“heptagon”,“octagon”,“nonagon”,“decagon”] |
Using the ‘by’ clause
The following example uses the make_list function and the by clause to create two lists of objects grouped by whether they have an even or odd number of sides.
let shapes = datatable (name: string, sideCount: int)
[
    "triangle", 3,
    "square", 4,
    "rectangle", 4,
    "pentagon", 5,
    "hexagon", 6,
    "heptagon", 7,
    "octagon", 8,
    "nonagon", 9,
    "decagon", 10
];
shapes
| summarize mylist = make_list(name) by isEvenSideCount = sideCount % 2 == 0
Output
| isEvenSideCount | mylist |
|---|---|
| false | [“triangle”,“pentagon”,“heptagon”,“nonagon”] |
| true | [“square”,“rectangle”,“hexagon”,“octagon”,“decagon”] |
Packing a dynamic object
The following examples show how to pack a dynamic object in a column before making it a list. It returns a column with a boolean table isEvenSideCount indicating whether the side count is even or odd and a mylist column that contains lists of packed bags int each category.
let shapes = datatable (name: string, sideCount: int)
[
    "triangle", 3,
    "square", 4,
    "rectangle", 4,
    "pentagon", 5,
    "hexagon", 6,
    "heptagon", 7,
    "octagon", 8,
    "nonagon", 9,
    "decagon", 10
];
shapes
| extend d = bag_pack("name", name, "sideCount", sideCount)
| summarize mylist = make_list(d) by isEvenSideCount = sideCount % 2 == 0
Output
| isEvenSideCount | mylist |
|---|---|
| false | [{“name”:“triangle”,“sideCount”:3},{“name”:“pentagon”,“sideCount”:5},{“name”:“heptagon”,“sideCount”:7},{“name”:“nonagon”,“sideCount”:9}] |
| true | [{“name”:“square”,“sideCount”:4},{“name”:“rectangle”,“sideCount”:4},{“name”:“hexagon”,“sideCount”:6},{“name”:“octagon”,“sideCount”:8},{“name”:“decagon”,“sideCount”:10}] |
Related content
29 - make_set_if() (aggregation function)
Creates a dynamic array of the set of distinct values that expr takes in records for which predicate evaluates to true.
Syntax
make_set_if(expr, predicate [, maxSize])
Parameters
| Name | Type | Required | Description |
|---|---|---|---|
| expr | string | ✔️ | The expression used for the aggregation calculation. |
| predicate | string | ✔️ | A predicate that has to evaluate to true in order for expr to be added to the result. |
| maxSize | int | The maximum number of elements returned. The default and max value is 1048576. |
Returns
Returns a dynamic array of the set of distinct values that expr takes in records for which predicate evaluates to true. The array’s sort order is undefined.
Example
The following example shows a list of names with more than four letters.
let T = datatable(name:string, day_of_birth:long)
[
   "John", 9,
   "Paul", 18,
   "George", 25,
   "Ringo", 7
];
T
| summarize make_set_if(name, strlen(name) > 4)
Output
| set_name |
|---|
| [“George”, “Ringo”] |
Related content
30 - make_set() (aggregation function)
Creates a dynamic array of the set of distinct values that expr takes in the group.
Syntax
make_set(expr [, maxSize])
Parameters
| Name | Type | Required | Description |
|---|---|---|---|
| expr | string | ✔️ | The expression used for the aggregation calculation. |
| maxSize | int | The maximum number of elements returned. The default and max value is 1048576. |
Returns
Returns a dynamic array of the set of distinct values that expr takes in the group.
The array’s sort order is undefined.
Example
Set from a scalar column
The following example shows the set of states grouped with the same amount of crop damage.
StormEvents
| summarize states=make_set(State) by DamageCrops
The results table shown includes only the first 10 rows.
| DamageCrops | states |
|---|---|
| 0 | [“NORTH CAROLINA”,“WISCONSIN”,“NEW YORK”,“ALASKA”,“DELAWARE”,“OKLAHOMA”,“INDIANA”,“ILLINOIS”,“MINNESOTA”,“SOUTH DAKOTA”,“TEXAS”,“UTAH”,“COLORADO”,“VERMONT”,“NEW JERSEY”,“VIRGINIA”,“CALIFORNIA”,“PENNSYLVANIA”,“MONTANA”,“WASHINGTON”,“OREGON”,“HAWAII”,“IDAHO”,“PUERTO RICO”,“MICHIGAN”,“FLORIDA”,“WYOMING”,“GULF OF MEXICO”,“NEVADA”,“LOUISIANA”,“TENNESSEE”,“KENTUCKY”,“MISSISSIPPI”,“ALABAMA”,“GEORGIA”,“SOUTH CAROLINA”,“OHIO”,“NEW MEXICO”,“ATLANTIC SOUTH”,“NEW HAMPSHIRE”,“ATLANTIC NORTH”,“NORTH DAKOTA”,“IOWA”,“NEBRASKA”,“WEST VIRGINIA”,“MARYLAND”,“KANSAS”,“MISSOURI”,“ARKANSAS”,“ARIZONA”,“MASSACHUSETTS”,“MAINE”,“CONNECTICUT”,“GUAM”,“HAWAII WATERS”,“AMERICAN SAMOA”,“LAKE HURON”,“DISTRICT OF COLUMBIA”,“RHODE ISLAND”,“LAKE MICHIGAN”,“LAKE SUPERIOR”,“LAKE ST CLAIR”,“LAKE ERIE”,“LAKE ONTARIO”,“E PACIFIC”,“GULF OF ALASKA”] |
| 30000 | [“TEXAS”,“NEBRASKA”,“IOWA”,“MINNESOTA”,“WISCONSIN”] |
| 4000000 | [“CALIFORNIA”,“KENTUCKY”,“NORTH DAKOTA”,“WISCONSIN”,“VIRGINIA”] |
| 3000000 | [“CALIFORNIA”,“ILLINOIS”,“MISSOURI”,“SOUTH CAROLINA”,“NORTH CAROLINA”,“MISSISSIPPI”,“NORTH DAKOTA”,“OHIO”] |
| 14000000 | [“CALIFORNIA”,“NORTH DAKOTA”] |
| 400000 | [“CALIFORNIA”,“MISSOURI”,“MISSISSIPPI”,“NEBRASKA”,“WISCONSIN”,“NORTH DAKOTA”] |
| 50000 | [“CALIFORNIA”,“GEORGIA”,“NEBRASKA”,“TEXAS”,“WEST VIRGINIA”,“KANSAS”,“MISSOURI”,“MISSISSIPPI”,“NEW MEXICO”,“IOWA”,“NORTH DAKOTA”,“OHIO”,“WISCONSIN”,“ILLINOIS”,“MINNESOTA”,“KENTUCKY”] |
| 18000 | [“WASHINGTON”,“WISCONSIN”] |
| 107900000 | [“CALIFORNIA”] |
| 28900000 | [“CALIFORNIA”] |
Set from array column
The following example shows the set of elements in an array.
datatable (Val: int, Arr1: dynamic)
[
    1, dynamic(['A1', 'A2', 'A3']),
    5, dynamic(['A2', 'C1']),
    7, dynamic(['C2', 'A3']),
    5, dynamic(['C2', 'A1'])
]
| summarize Val_set=make_set(Val), Arr1_set=make_set(Arr1)
| Val_set | Arr1_set |
|---|---|
| [1,5,7] | [“A1”,“A2”,“A3”,“C1”,“C2”] |
Related content
31 - max() (aggregation function)
Finds the maximum value of the expression in the table.
Syntax
max(expr)
Parameters
| Name | Type | Required | Description |
|---|---|---|---|
| expr | string | ✔️ | The expression for which the maximum value is determined. |
Returns
Returns the value in the table that maximizes the specified expression.
Example
The following example returns the last record in a table by querying the maximum value for StartTime.
StormEvents
| summarize LatestEvent=max(StartTime)
Output
| LatestEvent |
|---|
| 2007-12-31T23:53:00Z |
Related content
32 - maxif() (aggregation function)
Calculates the maximum value of expr in records for which predicate evaluates to true.
See also - max() function, which returns the maximum value across the group without predicate expression.
Syntax
maxif(expr,predicate)
Parameters
| Name | Type | Required | Description |
|---|---|---|---|
| expr | string | ✔️ | The expression used for the aggregation calculation. |
| predicate | string | ✔️ | The expression used to filter rows. |
Returns
Returns the maximum value of expr in records for which predicate evaluates to true.
Example
This example shows the maximum damage for events with no casualties.
StormEvents
| extend Damage=DamageCrops + DamageProperty, Deaths=DeathsDirect + DeathsIndirect
| summarize MaxDamageNoCasualties=maxif(Damage, Deaths == 0) by State
Output
The results table shown includes only the first 10 rows.
| – | – |
|---|---|
| TEXAS | 25000000 |
| KANSAS | 37500000 |
| IOWA | 15000000 |
| ILLINOIS | 5000000 |
| MISSOURI | 500005000 |
| GEORGIA | 344000000 |
| MINNESOTA | 38390000 |
| WISCONSIN | 45000000 |
| NEBRASKA | 4000000 |
| NEW YORK | 26000000 |
| … | … |
Related content
33 - min() (aggregation function)
Finds the minimum value of the expression in the table.
Syntax
min (expr)
Parameters
| Name | Type | Required | Description |
|---|---|---|---|
| expr | string | ✔️ | The expression for which the minimum value is determined. |
Returns
Returns the minimum value of expr across the table.
Example
This example returns the first record in a table.
StormEvents
| summarize FirstEvent=min(StartTime)
Output
| FirstEvent |
|---|
| 2007-01-01T00:00:00Z |
Related content
34 - minif() (aggregation function)
Returns the minimum of Expr in records for which Predicate evaluates to true.
- Can be used only in context of aggregation inside summarize
See also - min() function, which returns the minimum value across the group without predicate expression.
Syntax
minif (Expr,Predicate)
Parameters
| Name | Type | Required | Description |
|---|---|---|---|
| Expr | string | ✔️ | Expression that will be used for aggregation calculation. |
| Predicate | string | ✔️ | Expression that will be used to filter rows. |
Returns
The minimum value of Expr in records for which Predicate evaluates to true.
Example
This example shows the minimum damage for events with casualties (Except 0)
StormEvents
| extend Damage=DamageCrops+DamageProperty, Deaths=DeathsDirect+DeathsIndirect
| summarize MinDamageWithCasualties=minif(Damage,(Deaths >0) and (Damage >0)) by State
| where MinDamageWithCasualties >0 and isnotnull(MinDamageWithCasualties)
Output
The results table shown includes only the first 10 rows.
| State | MinDamageWithCasualties |
|---|---|
| TEXAS | 8000 |
| KANSAS | 5000 |
| IOWA | 45000 |
| ILLINOIS | 100000 |
| MISSOURI | 10000 |
| GEORGIA | 500000 |
| MINNESOTA | 200000 |
| WISCONSIN | 10000 |
| NEW YORK | 25000 |
| NORTH CAROLINA | 15000 |
| … | … |
Related content
35 - percentile(), percentiles()
The percentile() function calculates an estimate for the specified nearest-rank percentile of the population defined by expr.
The accuracy depends on the density of population in the region of the percentile.
percentiles() works similarly to percentile(). However, percentiles() can calculate multiple percentile values at once, which is more efficient than calculating each percentile value separately.
To calculate weighted percentiles, see percentilesw().
Syntax
percentile(expr, percentile)
percentiles(expr, percentiles)
Parameters
| Name | Type | Required | Description |
|---|---|---|---|
| expr | string | ✔️ | The expression to use for aggregation calculation. |
| percentile | real | ✔️ | A constant that specifies the percentile. |
| percentiles | real | ✔️ | One or more comma-separated percentiles. |
Returns
Returns a table with the estimates for expr of the specified percentiles in the group, each in a separate column.
Examples
The examples in this section show how to use the syntax to help you get started.
Calculate single percentile
The following example shows the value of DamageProperty being larger than 95% of the sample set and smaller than 5% of the sample set.
StormEvents | summarize percentile(DamageProperty, 95) by State
Output
The results table shown includes only the first 10 rows.
| State | percentile_DamageProperty_95 |
|---|---|
| ATLANTIC SOUTH | 0 |
| FLORIDA | 40000 |
| GEORGIA | 143333 |
| MISSISSIPPI | 80000 |
| AMERICAN SAMOA | 250000 |
| KENTUCKY | 35000 |
| OHIO | 150000 |
| KANSAS | 51392 |
| MICHIGAN | 49167 |
| ALABAMA | 50000 |
Calculate multiple percentiles
The following example shows the value of DamageProperty simultaneously calculated using 5, 50 (median) and 95.
StormEvents | summarize percentiles(DamageProperty, 5, 50, 95) by State
Output
The results table shown includes only the first 10 rows.
| State | percentile_DamageProperty_5 | percentile_DamageProperty_50 | percentile_DamageProperty_95 |
|---|---|---|---|
| ATLANTIC SOUTH | 0 | 0 | 0 |
| FLORIDA | 0 | 0 | 40000 |
| GEORGIA | 0 | 0 | 143333 |
| MISSISSIPPI | 0 | 0 | 80000 |
| AMERICAN SAMOA | 0 | 0 | 250000 |
| KENTUCKY | 0 | 0 | 35000 |
| OHIO | 0 | 2000 | 150000 |
| KANSAS | 0 | 0 | 51392 |
| MICHIGAN | 0 | 0 | 49167 |
| ALABAMA | 0 | 0 | 50000 |
| … | … |
Return percentiles as an array
Instead of returning the values in individual columns, use the percentiles_array() function to return the percentiles in a single column of dynamic array type.
Syntax
percentiles_array(expr, percentiles)
Parameters
| Name | Type | Required | Description |
|---|---|---|---|
| expr | string | ✔️ | The expression to use for aggregation calculation. |
| percentiles | real or dynamic | ✔️ | One or more comma-separated percentiles or a dynamic array of percentiles. Each percentile must be a real value. |
Returns
Returns an estimate for expr of the specified percentiles in the group as a single column of dynamic array type.
Examples
Comma-separated percentiles
Multiple percentiles can be obtained as an array in a single dynamic column, instead of in multiple columns as with percentiles().
TransformedSensorsData
| summarize percentiles_array(Value, 5, 25, 50, 75, 95), avg(Value) by SensorName
Output
The results table displays only the first 10 rows.
| SensorName | percentiles_Value | avg_Value |
|---|---|---|
| sensor-82 | [“0.048141473520867069”,“0.24407515500271132”,“0.48974511106780577”,“0.74160998970950343”,“0.94587903204190071”] | 0.493950914 |
| sensor-130 | [“0.049200214398937764”,“0.25735850440187535”,“0.51206374010048239”,“0.74182335059053839”,“0.95210342463616771”] | 0.505111463 |
| sensor-56 | [“0.04857779335488676”,“0.24709868149337144”,“0.49668762923789589”,“0.74458470404241883”,“0.94889104840865857”] | 0.497955018 |
| sensor-24 | [“0.051507199150534679”,“0.24803904945640423”,“0.50397070213183581”,“0.75653888126010793”,“0.9518782718727431”] | 0.501084379 |
| sensor-47 | [“0.045991246974755672”,“0.24644331118208851”,“0.48089197707088743”,“0.74475142784472248”,“0.9518322864959039”] | 0.49386228 |
| sensor-135 | [“0.05132897529660399”,“0.24204987641954018”,“0.48470113942206461”,“0.74275730068433621”,“0.94784079559229406”] | 0.494817619 |
| sensor-74 | [“0.048914714739047828”,“0.25160926036445724”,“0.49832498850160978”,“0.75257887767110776”,“0.94932261924236094”] | 0.501627252 |
| sensor-173 | [“0.048333149363009836”,“0.26084250046756496”,“0.51288012531934613”,“0.74964772791583412”,“0.95156058795294”] | 0.505401226 |
| sensor-28 | [“0.048511161184567046”,“0.2547387968731824”,“0.50101318228599656”,“0.75693845702682039”,“0.95243122486483989”] | 0.502066244 |
| sensor-34 | [“0.049980293859462954”,“0.25094722564949412”,“0.50914023067384762”,“0.75571549713447961”,“0.95176564809278674”] | 0.504309494 |
| … | … | … |
Dynamic array of percentiles
Percentiles for percentiles_array can be specified in a dynamic array of integer or floating-point numbers. The array must be constant but doesn’t have to be literal.
TransformedSensorsData
| summarize percentiles_array(Value, dynamic([5, 25, 50, 75, 95])), avg(Value) by SensorName
Output
The results table displays only the first 10 rows.
| SensorName | percentiles_Value | avg_Value |
|---|---|---|
| sensor-82 | [“0.048141473520867069”,“0.24407515500271132”,“0.48974511106780577”,“0.74160998970950343”,“0.94587903204190071”] | 0.493950914 |
| sensor-130 | [“0.049200214398937764”,“0.25735850440187535”,“0.51206374010048239”,“0.74182335059053839”,“0.95210342463616771”] | 0.505111463 |
| sensor-56 | [“0.04857779335488676”,“0.24709868149337144”,“0.49668762923789589”,“0.74458470404241883”,“0.94889104840865857”] | 0.497955018 |
| sensor-24 | [“0.051507199150534679”,“0.24803904945640423”,“0.50397070213183581”,“0.75653888126010793”,“0.9518782718727431”] | 0.501084379 |
| sensor-47 | [“0.045991246974755672”,“0.24644331118208851”,“0.48089197707088743”,“0.74475142784472248”,“0.9518322864959039”] | 0.49386228 |
| sensor-135 | [“0.05132897529660399”,“0.24204987641954018”,“0.48470113942206461”,“0.74275730068433621”,“0.94784079559229406”] | 0.494817619 |
| sensor-74 | [“0.048914714739047828”,“0.25160926036445724”,“0.49832498850160978”,“0.75257887767110776”,“0.94932261924236094”] | 0.501627252 |
| sensor-173 | [“0.048333149363009836”,“0.26084250046756496”,“0.51288012531934613”,“0.74964772791583412”,“0.95156058795294”] | 0.505401226 |
| sensor-28 | [“0.048511161184567046”,“0.2547387968731824”,“0.50101318228599656”,“0.75693845702682039”,“0.95243122486483989”] | 0.502066244 |
| sensor-34 | [“0.049980293859462954”,“0.25094722564949412”,“0.50914023067384762”,“0.75571549713447961”,“0.95176564809278674”] | 0.504309494 |
| … | … | … |
Nearest-rank percentile
P-th percentile (0 < P <= 100) of a list of ordered values, sorted in ascending order, is the smallest value in the list. The P percent of the data is less or equal to P-th percentile value (from Wikipedia article on percentiles).
Define 0-th percentiles to be the smallest member of the population.
Estimation error in percentiles
The percentiles aggregate provides an approximate value using T-Digest.
Related content
36 - percentilew(), percentilesw()
The percentilew() function calculates a weighted estimate for the specified nearest-rank percentile of the population defined by expr. percentilesw() works similarly to percentilew(). However, percentilesw() can calculate multiple weighted percentile values at once, which is more efficient than calculating each weighted percentile value separately.
Weighted percentiles calculate percentiles in a dataset by giving each value in the input dataset a weight. In this method, each value is considered to be repeated a number of times equal to its weight, which is then used to calculate the percentile. By giving more importance to certain values, weighted percentiles provide a way to calculate percentiles in a “weighted” manner.
To calculate unweighted percentiles, see percentiles().
Syntax
percentilew(expr, weightExpr, percentile)
percentilesw(expr, weightExpr, percentiles)
Parameters
| Name | Type | Required | Description |
|---|---|---|---|
| expr | string | ✔️ | The expression to use for aggregation calculation. |
| weightExpr | long | ✔️ | The weight to give each value. |
| percentile | real | ✔️ | A constant that specifies the percentile. |
| percentiles | real | ✔️ | One or more comma-separated percentiles. |
Returns
Returns a table with the estimates for expr of the specified percentiles in the group, each in a separate column.
Examples
The examples in this section show how to use the syntax to help you get started.
Calculate weighted percentiles
Assume you repetitively measure the time (Duration) it takes an action to complete. Instead of recording every value of the measurement, you record each value of Duration, rounded to 100 msec, and how many times the rounded value appeared (BucketSize).
Use summarize percentilesw(Duration, BucketSize, ...) to calculate the given
percentiles in a “weighted” way. Treat each value of Duration as if it was repeated BucketSize times in the input, without actually needing to materialize those records.
The following example shows weighted percentiles.
Using the following set of latency values in milliseconds:
{ 1, 1, 2, 2, 2, 5, 7, 7, 12, 12, 15, 15, 15, 18, 21, 22, 26, 35 }.
To reduce bandwidth and storage, do pre-aggregation to the
following buckets: { 10, 20, 30, 40, 50, 100 }. Count the number of events in each bucket to produce the following table:
let latencyTable = datatable (ReqCount:long, LatencyBucket:long)
[
    8, 10,
    6, 20,
    3, 30,
    1, 40
];
latencyTable
The table displays:
- Eight events in the 10-ms bucket (corresponding to subset
{ 1, 1, 2, 2, 2, 5, 7, 7 }) - Six events in the 20-ms bucket (corresponding to subset
{ 12, 12, 15, 15, 15, 18 }) - Three events in the 30-ms bucket (corresponding to subset
{ 21, 22, 26 }) - One event in the 40-ms bucket (corresponding to subset
{ 35 })
At this point, the original data is no longer available. Only the number of events in each bucket. To compute percentiles from this data, use the percentilesw() function.
For the 50, 75, and 99.9 percentiles, use the following query:
let latencyTable = datatable (ReqCount:long, LatencyBucket:long)
[
    8, 10,
    6, 20,
    3, 30,
    1, 40
];
latencyTable
| summarize percentilesw(LatencyBucket, ReqCount, 50, 75, 99.9)
Output
| percentile_LatencyBucket_50 | percentile_LatencyBucket_75 | percentile_LatencyBucket_99_9 |
|---|---|---|
| 20 | 20 | 40 |
Return percentiles as an array
Instead of returning the values in individual columns, use the percentilesw_array() function to return the percentiles in a single column of dynamic array type.
Syntax
percentilesw_array(expr, weightExpr, percentiles)
Parameters
| Name | Type | Required | Description |
|---|---|---|---|
| expr | string | ✔️ | The expression to use for aggregation calculation. |
| percentiles | real or dynamic | ✔️ | One or more comma-separated percentiles or a dynamic array of percentiles. Each percentile must be a real value. |
| weightExpr | long | ✔️ | The weight to give each value. |
Returns
Returns an estimate for expr of the specified percentiles in the group as a single column of dynamic array type.
Examples
The examples in this section show how to use the syntax to help you get started.
Comma-separated percentiles
let latencyTable = datatable (ReqCount:long, LatencyBucket:long)
[
    8, 10,
    6, 20,
    3, 30,
    1, 40
];
latencyTable
| summarize percentilesw_array(LatencyBucket, ReqCount, 50, 75, 99.9)
Output
| percentile_LatencyBucket | ||
|---|---|---|
| [20, 20, 40] |
Dynamic array of percentiles
let latencyTable = datatable (ReqCount:long, LatencyBucket:long)
[
    8, 10,
    6, 20,
    3, 30,
    1, 40
];
latencyTable
| summarize percentilesw_array(LatencyBucket, ReqCount, dynamic([50, 75, 99.9]))
Output
| percentile_LatencyBucket | ||
|---|---|---|
| [20, 20, 40] |
Related content
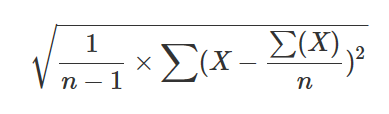
37 - stdev() (aggregation function)
Calculates the standard deviation of expr across the group, using Bessel’s correction for a small dataset that is considered a sample.
For a large dataset that is representative of the population, use stdevp() (aggregation function).
Formula
This function uses the following formula.
Syntax
stdev(expr)
Parameters
| Name | Type | Required | Description |
|---|---|---|---|
| expr | string | ✔️ | The expression used for the standard deviation aggregation calculation. |
Returns
Returns the standard deviation value of expr across the group.
Example
The following example shows the standard deviation for the group.
range x from 1 to 5 step 1
| summarize make_list(x), stdev(x)
Output
| list_x | stdev_x |
|---|---|
| [ 1, 2, 3, 4, 5] | 1.58113883008419 |
38 - stdevif() (aggregation function)
Calculates the standard deviation of expr in records for which predicate evaluates to true.
Syntax
stdevif(expr,predicate)
Parameters
| Name | Type | Required | Description |
|---|---|---|---|
| expr | string | ✔️ | The expression used for the standards deviation aggregation calculation. |
| predicate | string | ✔️ | The predicate that has to evaluate to true in order for expr to be added to the result. |
Returns
Returns the standard deviation value of expr in records for which predicate evaluates to true.
Example
The following example shows the standard deviation in a range of 1 to 100.
range x from 1 to 100 step 1
| summarize stdevif(x, x % 2 == 0)
Output
| stdevif_x |
|---|
| 29.1547594742265 |
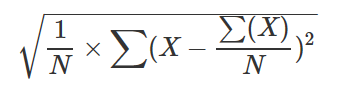
39 - stdevp() (aggregation function)
Calculates the standard deviation of expr across the group, considering the group as a population for a large dataset that is representative of the population.
For a small dataset that is a sample, use stdev() (aggregation function).
Formula
This function uses the following formula.
Syntax
stdevp(expr)
Parameters
| Name | Type | Required | Description |
|---|---|---|---|
| expr | string | ✔️ | The expression used for the standards deviation aggregation calculation. |
Returns
Returns the standard deviation value of expr across the group.
Example
range x from 1 to 5 step 1
| summarize make_list(x), stdevp(x)
Output
| list_x | stdevp_x |
|---|---|
| [ 1, 2, 3, 4, 5] | 1.4142135623731 |
40 - sum() (aggregation function)
Calculates the sum of expr across the group.
Syntax
sum(expr)
Parameters
| Name | Type | Required | Description |
|---|---|---|---|
| expr string | ✔️ | The expression used for the aggregation calculation. |
Returns
Returns the sum value of expr across the group.
Example
This example returns the total value of crop and property damages by state, and sorted in descending value.
StormEvents
| summarize EventCount=count(), TotalDamages = sum(DamageCrops+DamageProperty) by State
| sort by TotalDamages
Output
The results table shown includes only the first 10 rows.
| State | Eventcount | TotalDamages | | —- | — | | CALIFORNIA | 898 | 2801954600 | | GEORGIA | 1983 | 1190448750 | | MISSOURI | 2016 | 1096887450 | | OKLAHOMA | 1716 | 916557300 | | MISSISSIPPI | 1218 | 802890160 | | KANSAS | 3166 | 738830000 | | TEXAS | 4701 | 572086700 | | OHIO | 1233 | 417989500 | | FLORIDA | 1042 | 379455260 | | NORTH DAKOTA | 905 | 342460100 | | … | … | … |
41 - sumif() (aggregation function)
Calculates the sum of expr in records for which predicate evaluates to true.
You can also use the sum() function, which sums rows without predicate expression.
Syntax
sumif(expr,predicate)
Parameters
| Name | Type | Required | Description |
|---|---|---|---|
| expr | string | ✔️ | The expression used for the aggregation calculation. |
| predicate | string | ✔️ | The expression used to filter rows. If the predicate evaluates to true, the row will be included in the result. |
Returns
Returns the sum of expr for which predicate evaluates to true.
Example showing the sum of damages based on no casualty count
This example shows the sum total damage for storms without casualties.
StormEvents
| summarize DamageNoCasualties=sumif((DamageCrops+DamageProperty),(DeathsDirect+DeathsIndirect)==0) by State
Output
The results table shown includes only the first 10 rows.
| State | DamageNoCasualties |
|---|---|
| TEXAS | 242638700 |
| KANSAS | 407360000 |
| IOWA | 135353700 |
| ILLINOIS | 120394500 |
| MISSOURI | 1096077450 |
| GEORGIA | 1077448750 |
| MINNESOTA | 230407300 |
| WISCONSIN | 241550000 |
| NEBRASKA | 70356050 |
| NEW YORK | 58054000 |
| … | … |
Example showing the sum of birth dates
This example shows the sum of the birth dates for all names that have more than 4 letters.
let T = datatable(name:string, day_of_birth:long)
[
   "John", 9,
   "Paul", 18,
   "George", 25,
   "Ringo", 7
];
T
| summarize sumif(day_of_birth, strlen(name) > 4)
Output
| sumif_day_of_birth |
|---|
| 32 |
42 - take_any() (aggregation function)
Arbitrarily chooses one record for each group in a summarize operator, and returns the value of one or more expressions over each such record.
Syntax
take_any(expr_1 [, expr_2 …])
take_any(*)
Parameters
| Name | Type | Required | Description |
|---|---|---|---|
| expr_N | string | ✔️ | The expression used for selecting a record. If the wildcard value (*) is given in place of an expression, all records will be selected. |
Returns
The take_any aggregation function returns the values of the expressions calculated
for each of the records selected Indeterministically from each group of the summarize operator.
If the * argument is provided, the function behaves as if the expressions are all columns
of the input to the summarize operator barring the group-by columns, if any.
Remarks
This function is useful when you want to get a sample value of one or more columns per value of the compound group key.
When the function is provided with a single column reference, it will attempt to return a non-null/non-empty value, if such value is present.
As a result of the indeterministic nature of this function, using this function multiple times in
a single application of the summarize operator isn’t equivalent to using
this function a single time with multiple expressions. The former may have each application
select a different record, while the latter guarantees that all values are calculated
over a single record (per distinct group).
Examples
Show indeterministic State:
StormEvents
| summarize take_any(State)
Output
| State |
|---|
| ATLANTIC SOUTH |
Show all the details for a random record:
StormEvents
| project StartTime, EpisodeId, State, EventType
| summarize take_any(*)
Output
| StartTime | EpisodeId | State | EventType |
|---|---|---|---|
| 2007-09-29 08:11:00.0000000 | 11091 | ATLANTIC SOUTH | Waterspout |
Show all the details of a random record for each State starting with ‘A’:
StormEvents
| where State startswith "A"
| project StartTime, EpisodeId, State, EventType
| summarize take_any(*) by State
Output
| State | StartTime | EpisodeId | EventType |
|---|---|---|---|
| ALASKA | 2007-02-01 00:00:00.0000000 | 1733 | Flood |
| ATLANTIC SOUTH | 2007-09-29 08:11:00.0000000 | 11091 | Waterspout |
| ATLANTIC NORTH | 2007-11-27 00:00:00.0000000 | 11523 | Marine Thunderstorm Wind |
| ARIZONA | 2007-12-01 10:40:00.0000000 | 11955 | Flash Flood |
| AMERICAN SAMOA | 2007-12-07 14:00:00.0000000 | 13183 | Flash Flood |
| ARKANSAS | 2007-12-09 16:00:00.0000000 | 11319 | Lightning |
| ALABAMA | 2007-12-15 18:00:00.0000000 | 12580 | Heavy Rain |
Related content
43 - take_anyif() (aggregation function)
Arbitrarily selects one record for each group in a summarize operator in records for which the predicate is ’true’. The function returns the value of an expression over each such record.
This function is useful when you want to get a sample value of one column per value of the compound group key, subject to some predicate that is true. If such a value is present, the function attempts to return a non-null/non-empty value.
Syntax
take_anyif( expr, predicate )
Parameters
| Name | Type | Required | Description |
|---|---|---|---|
| expr | string | ✔️ | The expression used for selecting a record. |
| predicate | string | ✔️ | Indicates which records may be considered for evaluation. |
Returns
The take_anyif aggregation function returns the value of the expression calculated
for each of the records randomly selected from each group of the summarize operator. Only records for which predicate returns ’true’ may be selected. If the predicate doesn’t return ’true’, a null value is produced.
Examples
Pick a random EventType from Storm events, where event description has a key phrase.
StormEvents
| summarize take_anyif(EventType, EventNarrative has 'strong wind')
Output
| EventType |
|---|
| Strong Wind |
Related content
44 - tdigest_merge() (aggregation functions)
Merges tdigest results across the group.
For more information about the underlying algorithm (T-Digest) and the estimated error, see estimation error in percentiles.
Syntax
tdigest_merge(expr)
Parameters
| Name | Type | Required | Description |
|---|---|---|---|
| expr | string | ✔️ | The expression used for the aggregation calculation. |
Returns
Returns the merged tdigest values of expr across the group.
Example
StormEvents
| summarize PreAggDamageProperty=tdigest(DamageProperty) by State
| summarize tdigest_merge(PreAggDamageProperty)
Output
| merge_tdigests_PreAggDamageProperty |
|---|
| [[7],[91,30,73667,966,110000000,24428,2500,20000,16500000,6292,40000,123208,1000000,133091,90583,20000000,977000,20007,547000,19000000,1221,9600000,300000,70072,55940,75000,417500,1410000,20400000,331500,15000000,62000000,50222,121690000,160400,6200000,252500,450,11000000,2200000,5700000,11566,12000000,263,50000,200000,3700000,13286,171000,100000000,28200000,65000000,17709,30693,16000000,7938,5200,2875,1500000,3480000,151100000,9800000,18200000,21600000,199,2570000,30000000,38000000,72000,891250,500000000,26385,80092,27000000,35000000,754500,11500000,3262500,113945,5000,62429,175294,9071,6500000,3321,15159,21850000,300000000,22683,3000,10000000,60055,600000,52000000,496000,15000,50000000,10140000,11900000,2100000,62600000,77125,310667,70000000,101000000,2088,1608571,19182,400000,179833,775000,612000,150000000,13500000,2600000,1250000,65400,45000000,297000,2500000,40000000,24846,30000,59067,1893,15762,142571,220666,195000,2000000,355000,2275000,6000000,46000000,38264,50857,4002,97333,27750,1000,1111429,7043,272500,455200,503,37500000,10000,1489,0,1200000,110538,60000000,250000,10730,1901429,291000,698750,649000,2716667,137000000,6400000,29286,41051,6850000,102000,4602,80000000,250000000,371667,8000000,729,8120000,5000000,20830,152400,803300,349667,202000,207000,81150000,48000000,750000,26000000,8900000,239143,75000000,248000,14342,74857,5992,500000,150000,938000,10533333,45248,105000000,7000000,35030,4000000,2000,7692500,3000000,25000000,4500000,87222,12054,100000,25000,9771,4840000,28000000,1307143,32024],[19,1,3,32,1,14,45,572,1,51,126,41,101,11,12,8,2,14,4,1,27,1,58,42,20,177,6,4,1,12,10,2,9,1,5,1,2,28,3,6,1,23,4,30,610,145,1,21,4,2,1,1,24,13,1,153,5,4,26,5,1,6,1,1,28,1,5,1,11,4,1,13,44,2,4,2,1,4,9,1672,7,17,47,2,39,17,2,1,17,666,16,71,21,3,1,530,10,1,1,2,1,4,6,4,1,20,7,11,40,6,2,1,1,2,1,3,5,2,1,21,2,13,271,3,14,23,7,15,2,41,1,2,7,1,27,7,205,3,4,1403,7,69,4,10,215,1,1472,127,45756,10,13,1,198,17,7,1,12,7,6,1,1,14,7,2,2,17,1,2,3,2,48,5,21,10,5,10,21,4,5,1,2,39,2,2,7,1,1,22,7,60,175,119,3,3,40,1,8,101,15,1135,4,22,3,3,9,76,430,611,12,1,2,7,8]] |
45 - tdigest() (aggregation function)
Calculates the intermediate results of percentiles() across the group.
For more information, see the underlying algorithm (T-Digest) and the estimated error.
Syntax
tdigest(expr [, weight])
Parameters
| Name | Type | Required | Description |
|---|---|---|---|
| expr | string | ✔️ | The expression used for the aggregation calculation. |
| weight | string | The weights of the values for the aggregation calculation. |
Returns
The Intermediate results of weighted percentiles of *expr* across the group.
Examples
Results per state
This example shows the results of the tdigest percentiles sorted by state.
StormEvents
| summarize tdigest(DamageProperty) by State
The results table shown includes only the first 10 rows.
| State | tdigest_DamageProperty |
|---|---|
| NEBRASKA | [[7],[800,250,300000,5000,240000,1500000,20000,550000,0,75000,100000,1000,10000,30000,13000,2000000,1000000,650000,125000,35000,7000,2500000,4000000,450000,85000,460000,500000,6000,150000,350000,4000,72500,1200000,180000,400000,25000,50000,2000,45000,8000,120000,200000,40000,1200,15000,55000,3000,250000],[5,1,3,72,1,1,44,1,1351,12,24,17,46,13,6,1,2,1,2,6,8,1,1,1,2,1,4,2,6,1,2,2,1,1,2,26,18,12,2,2,1,7,6,4,28,4,6,6]] |
| MINNESOTA | [[7],[700,500,2000000,2500,1200000,12000000,16000,7000000,0,300000,425000,750,6000,30000,10000,22000000,10000000,9600000,600000,50000,4000,27000000,35000000,4000000,400000,5000000,6000000,3000,750000,2500000,2000,250000,11000000,38000000,3000000,20000,120000,1000,100000,5000,500000,1000000,60000,800,15000,200000,1500,1500000,900000],[1,3,1,3,1,2,1,1,1793,1,1,2,2,2,3,1,1,1,2,2,1,1,1,1,2,1,2,1,1,1,6,1,1,1,3,5,1,5,2,5,2,2,1,2,2,2,2,1,1]] |
| KANSAS | [[7],[667,200,6000000,3400,80000,300000,18875,210000,0,45857,750000,37500000,10000,81150000,15000000,6400000,2570000,225000,59400,25000,5000,400000,7000000,4500000,2500000,6500000,200000,4500,70000,122500,2785,12000000,1900000,18200000,150000,1150000,27000000,2000,30000,2000000,250000000,75000,26000,1500,1500000,1000000,2500,100000,21600000,50000,335000,600000,175000,500000,160000,51000,40000,20000,15000,252500,7520,350000,250000,3400000,1000,338000,16000000,106000,4840000,305000,540000,337500,9800000,45000,12500,700000,4000000,71000,30000000,35000,3700000,22000,56000],[12,2,2,5,2,3,8,1,2751,7,2,1,37,1,1,1,1,2,5,12,33,8,1,1,1,2,10,1,5,2,7,1,4,1,5,1,1,9,11,4,1,5,2,6,4,8,2,23,1,44,2,3,2,3,1,1,1,18,5,2,5,1,7,1,25,1,1,3,1,1,1,2,6,1,1,2,1,1,1,3,1,1,1]] |
| NEW MEXICO | [[7],[600,500,2500000,7000,1500,28000,40000,10000,0,500000,20000,1000,21000,70000,25000,3500000,200000,16500000,50000,100000,15000,4000,5000,2000],[1,3,1,1,1,1,1,7,466,1,7,4,1,1,2,1,1,1,1,2,1,4,10,8]] |
| KENTUCKY | [[7],[600,200,700000,5000,400000,12000,15000,100000,0,60000,80000,1000,9000,20000,10000,50000,30000,300000,120000,25000,7000,3000,500000,11500000,75000,35000,8000,6000,150000,1500000,4000,56000,1911,250000,2500000,18000,45000,2000],[6,2,1,42,1,3,9,8,999,2,1,52,1,21,37,25,7,2,3,14,11,35,1,1,6,10,9,10,4,1,13,1,9,3,1,2,1,37]] |
| VIRGINIA | [[7],[536,500,125000,3000,100000,7250,8000,60000,0,40000,50000,956,6000,11500,7000,25000,15000,98000,70000,12000,4000,2000,120000,1000000,45000,16000,5000,3500,75000,175000,2500,30000,1000,80000,300000,10000,20000,1500],[7,11,1,48,2,2,2,1,1025,2,6,9,2,2,1,5,16,1,3,5,12,122,1,1,1,1,64,2,2,1,1,7,209,3,2,42,19,6]] |
| OREGON | [[7],[5000,1000,60000,434000,20000,50000,100000,500000,0,1500000,20400000,6000,62600000],[8,2,1,1,1,1,3,1,401,1,1,1,1]] |
| ALASKA | [[7],[5000,1000,25000,700000,12060,15000,100000,1600000,0,10000],[5,1,1,1,1,2,1,2,242,1]] |
| CONNECTICUT | [[7],[5000,1000,2000000,0,50000,750000,6000],[1,1,1,142,1,1,1]] |
| NEVADA | [[7],[5000,1000,200000,1000000,30000,40000,297000,5000000,0,10000],[4,2,1,1,1,1,1,1,148,3]] |
Convert pre-existing centroids
The following example shows how one can convert pre-existing T-Digest centroids for long-term storage.
The V column holds the value of each centroid, and the W column is its weight (relative count).
The tdigest() aggregate function is then applied to convert the data in table DT into the internal
representation, and percentile_tdigest() is used to demonstrate how ot find the 50-tile value.
let DT=datatable(V:real, W:long) [
    1.0, 1,
    2.0, 2
];
DT
| summarize TD=tdigest(V, W)
| project P50=percentile_tdigest(TD, 50)
| P50 |
|---|
| 2 |
46 - variance() (aggregation function)
Calculates the variance of expr across the group, considering the group as a sample.
The following formula is used:
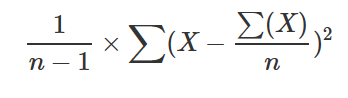
Syntax
variance(expr)
Parameters
| Name | Type | Required | Description |
|---|---|---|---|
| expr | real | ✔️ | The expression used for the variance calculation. |
Returns
Returns the variance value of expr across the group.
Example
range x from 1 to 5 step 1
| summarize make_list(x), variance(x)
Output
| list_x | variance_x |
|---|---|
| [ 1, 2, 3, 4, 5] | 2.5 |
47 - varianceif() (aggregation function)
Calculates the variance of expr in records for which predicate evaluates to true.
Syntax
varianceif(expr, predicate)
Parameters
| Name | Type | Required | Description |
|---|---|---|---|
| expr | string | ✔️ | The expression to use for the variance calculation. |
| predicate | string | ✔️ | If predicate evaluates to true, the expr calculated value will be added to the variance. |
Returns
Returns the variance value of expr in records for which predicate evaluates to true.
Example
range x from 1 to 100 step 1
| summarize varianceif(x, x%2 == 0)
Output
| varianceif_x |
|---|
| 850 |
48 - variancep() (aggregation function)
Calculates the variance of expr across the group, considering the group as a population.
The following formula is used:
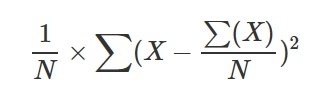
Syntax
variancep(expr)
Parameters
| Name | Type | Required | Description |
|---|---|---|---|
| expr | string | ✔️ | The expression to use for the variance calculation. |
Returns
Returns the variance value of expr across the group.
Example
range x from 1 to 5 step 1
| summarize make_list(x), variancep(x)
Output
| list_x | variance_x |
|---|---|
| [ 1, 2, 3, 4, 5] | 2 |