geo_line_interpolate_point()
Calculates a point at fraction value on a line on Earth.
Syntax
geo_line_interpolate_point(lineString,fraction)
Parameters
| Name | Type | Required | Description |
|---|---|---|---|
| lineString | dynamic | ✔️ | A LineString in the GeoJSON format. |
| fraction | real | ✔️ | fraction value should be between 0 (start of the line) and 1 (end of the line). |
Returns
The point coordinate value in GeoJSON Format and of a dynamic data type on line string at the specific fraction value. If the line or fraction value is invalid, the query produces a null result.
LineString definition and constraints
dynamic({“type”: “LineString”,“coordinates”: [[lng_1,lat_1], [lng_2,lat_2], …, [lng_N,lat_N]]})
- LineString coordinates array must contain at least two entries.
- Coordinates [longitude, latitude] must be valid where longitude is a real number in the range [-180, +180] and latitude is a real number in the range [-90, +90].
- Edge length must be less than 180 degrees. The shortest edge between the two vertices is chosen.
Examples
The following example calculates a point at 25% location since line start.
let line = dynamic({"type":"LineString","coordinates":[[-73.95796, 40.80042], [-73.97317, 40.764486]]});
print point = geo_line_interpolate_point(line, 0.25);
Output
| point |
|---|
| {“type”: “Point”, “coordinates”: [-73.961764043218281, 40.791436687257232]} |
The following example calculates point longitude at 90% since line start.
let line = dynamic({"type":"LineString","coordinates":[[-73.95807266235352,40.800426144169315],[-73.94966125488281,40.79691751000055],[-73.97317886352539,40.764486356930334],[-73.98210525512695,40.76786669510221],[-73.96004676818848,40.7980870753293]]});
print point = geo_line_interpolate_point(line, 0.9)
| project lng = point.coordinates[0]
Output
| result |
|---|
| -73.96556545832799 |
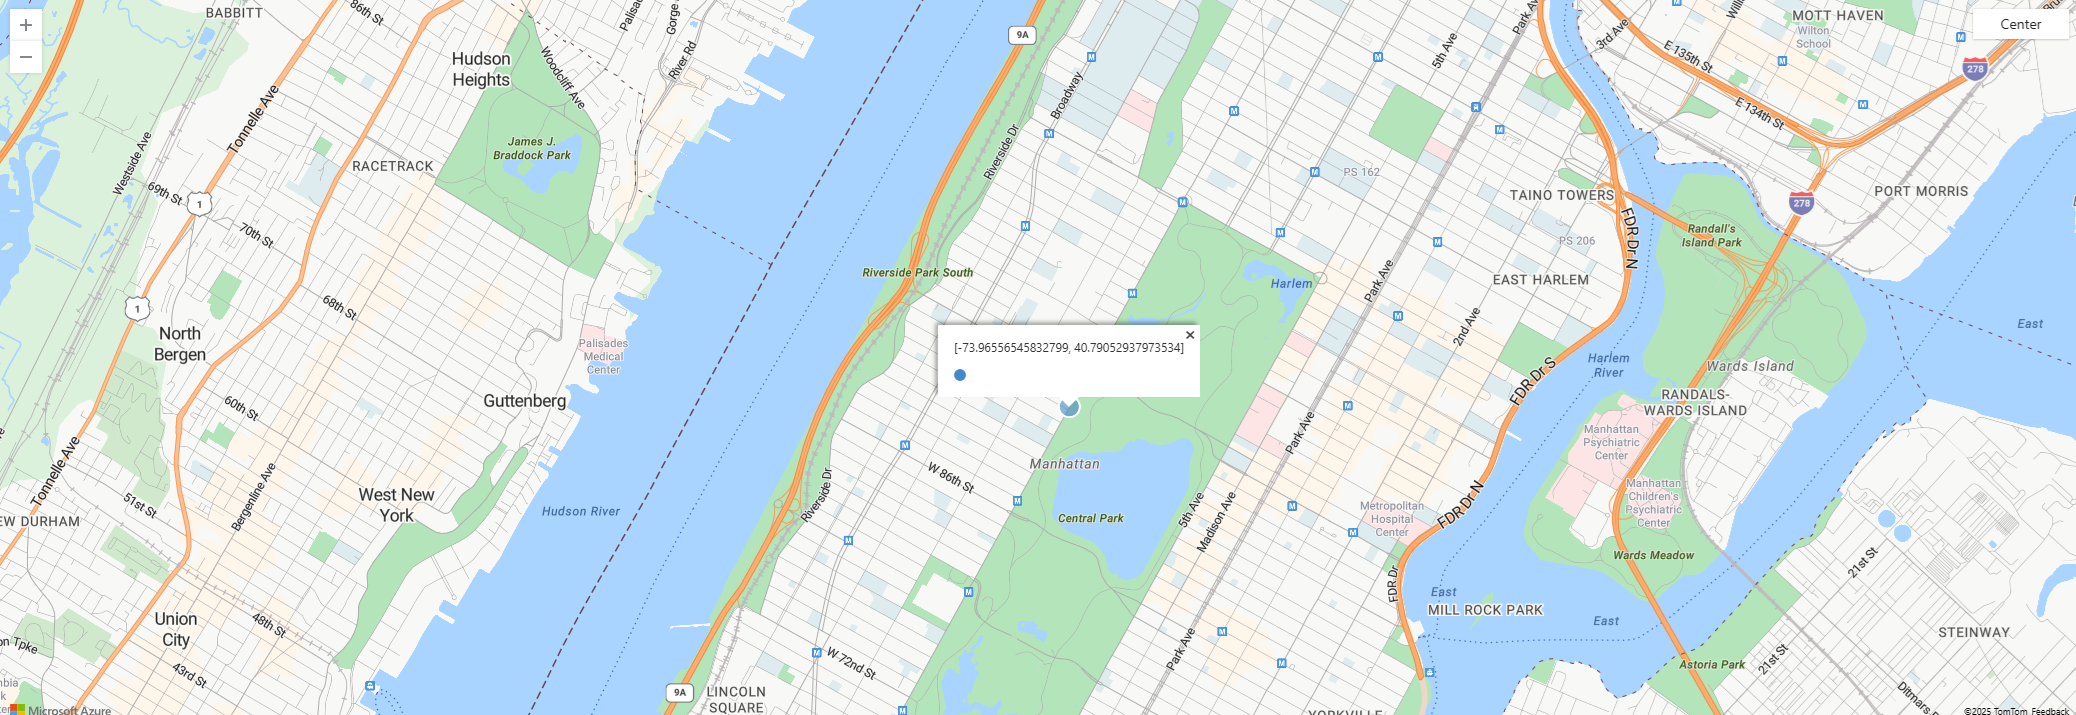
The following example visualizes point on a map.
let line = dynamic({"type":"LineString","coordinates":[[-73.95807266235352,40.800426144169315],[-73.94966125488281,40.79691751000055],[-73.97317886352539,40.764486356930334],[-73.98210525512695,40.76786669510221],[-73.96004676818848,40.7980870753293]]});
print point = geo_line_interpolate_point(line, 0.9)
| render scatterchart with (kind = map)
The following example returns true because of the invalid line.
print is_bad_line = isnull(geo_line_interpolate_point(dynamic({"type":"LineString","coordinates":[[1, 1]]}), 0.5))
Output
| is_bad_line |
|---|
| true |
Feedback
Was this page helpful?
Glad to hear it! Please tell us how we can improve.
Sorry to hear that. Please tell us how we can improve.