This is the multi-page printable view of this section. Click here to print.
Operators
1 - Graph operators
Graph operators enable graph analysis of data by representing tabular data as a graph with nodes and edges, or by referencing persistent graph entities. This setup lets you use graph operations to study the connections and relationships between different data points.
Graph analysis can be performed using either transient graphs (created dynamically from tabular data using make-graph) or persistent graphs (referenced using the graph function). Once a graph is established, you can use graph operators such as graph-match, graph-shortest-paths, and graph-to-table to analyze relationships, find patterns, and transform results back into tabular form for further processing.
Supported graph operators
The following table describes the supported graph operators.
| Operator | Description |
|---|---|
| make-graph | Builds a graph from tabular data. |
| graph | References a persisted graph entity and retrieves the latest or a specific snapshot. |
| graph-match | Searches for patterns in a graph. |
| graph-to-table | Builds nodes or edges tables from a graph. |
| graph-shortest-paths | Finds the shortest paths from a given set of source nodes to a set of target nodes. |
| graph-mark-components | Finds and marks all connected components. |
Related content
2 - graph-mark-components operator (preview)
The graph-mark-components operator finds all connected components of a graph and marks each node with a component identifier.
Syntax
G | graph-mark-components [kind = Kind] [with_component_id = ComponentId]
Parameters
| Name | Type | Required | Description |
|---|---|---|---|
| G | string | ✔️ | The graph source. |
| Kind | string | The connected component kind, either weak (default) or strong. A weak component is a set of nodes connected by a path, ignoring the direction of edges. A strong component is a set of nodes connected in both directions, considering the edges’ directions. | |
| ComponentId | string | The property name that denotes the component identifier. The default property name is ComponentId. |
Returns
The graph-mark-components operator returns a graph result, where each node has a component identifier in the ComponentId property. The identifier is a zero-based consecutive index of the components. Each component index is chosen arbitrarily and might not be consistent across runs.
Examples
The following example creates a graph from a set of child-parent pairs and identifies connected components using a family identifier.
let ChildOf = datatable(child:string, parent:string)
[
  "Alice", "Bob",
  "Carol", "Alice",
  "Carol", "Dave",
  "Greg", "Alice",
  "Greg", "Dave",
  "Howard", "Alice",
  "Howard", "Dave",
  "Eve", "Frank",
  "Frank", "Mallory",
  "Eve", "Kirk",
];
ChildOf
| make-graph child --> parent with_node_id=name
| graph-mark-components with_component_id = family
| graph-to-table nodes
Output
| name | family |
|---|---|
| Alice | 0 |
| Bob | 0 |
| Carol | 0 |
| Dave | 0 |
| Greg | 0 |
| Howard | 0 |
| Eve | 1 |
| Frank | 1 |
| Mallory | 1 |
| Kirk | 1 |
The following example uses the connected component family identifier and the graph-match operator to identify the greatest ancestor of each family in a set of child-parent data.
let ChildOf = datatable(child:string, parent:string)
[
  "Alice", "Bob",
  "Carol", "Alice",
  "Carol", "Dave",
  "Greg", "Alice",
  "Greg", "Dave",
  "Howard", "Alice",
  "Howard", "Dave",
  "Eve", "Frank",
  "Frank", "Mallory",
  "Eve", "Kirk",
];
ChildOf
| make-graph child --> parent with_node_id=name
| graph-mark-components with_component_id = family
| graph-match (descendant)-[childOf*1..5]->(ancestor)
  project name = ancestor.name, lineage = map(childOf, child), family = ancestor.family
| summarize (generations, name) = arg_max(array_length(lineage),name) by family
Output
| family | generations | name |
|---|---|---|
| 1 | 2 | Mallory |
| 0 | 2 | Bob |
Related content
3 - graph-match operator
The graph-match operator searches for all occurrences of a graph pattern in an input graph source.
Syntax
G | graph-match [cycles = CyclesOption] Pattern [where Constraints] project [ColumnName =] Expression [, …]
Parameters
| Name | Type | Required | Description |
|---|---|---|---|
| G | string | ✔️ | The input graph source. |
| Pattern | string | ✔️ | One or more comma delimited sequences of graph node elements connected by graph edge elements using graph notations. See Graph pattern notation. |
| Constraints | string | A Boolean expression composed of properties of named variables in the Pattern. Each graph element (node/edge) has a set of properties that were attached to it during the graph construction. The constraints define which elements (nodes and edges) are matched by the pattern. A property is referenced by the variable name followed by a dot (.) and the property name. | |
| Expression | string | ✔️ | The project clause converts each pattern to a row in a tabular result. The project expressions must be scalar and reference properties of named variables defined in the Pattern. A property is referenced by the variable name followed by a dot (.) and the attribute name. |
| CyclesOption | string | Controls whether cycles are matched in the Pattern, allowed values: all, none, unique_edges. If all is specified, then all cycles are matched, if none is specified cycles aren’t matched, if unique_edges (default) is specified, cycles are matched but only if the cycles don’t include the same edge more than once. |
Graph pattern notation
The following table shows the supported graph notation:
| Element | Named variable | Anonymous |
|---|---|---|
| Node | (n) | () |
| Directed edge: left to right | -[e]-> | --> |
| Directed edge: right to left | <-[e]- | <-- |
| Any direction edge | -[e]- | -- |
| Variable length edge | -[e*3..5]- | -[*3..5]- |
Variable length edge
A variable length edge allows a specific pattern to be repeated multiple times within defined limits. This type of edge is denoted by an asterisk (*), followed by the minimum and maximum occurrence values in the format min..max. Both the minimum and maximum values must be integer scalars. Any sequence of edges falling within this occurrence range can match the variable edge of the pattern, if all the edges in the sequence satisfy the constraints outlined in the where clause.
Multiple sequences
Multiple comma delimited sequences are used to express nonlinear patterns. To describe the connection between different sequences, they have to share one or more variable name of a node. For example, to represent a star pattern with node n at the center connected to nodes a,b,c, and d, the following pattern could be used:
(a)--(n)--(b),(c)--(n)--(d)
Only single connected component patterns are supported.
Returns
The graph-match operator returns a tabular result, where each record corresponds to a match of the pattern in the graph.
The returned columns are defined in the operator’s project clause using properties of edges and/or nodes defined in the pattern. Properties and functions of properties of variable length edges are returned as a dynamic array, each value in the array corresponds to an occurrence of the variable length edge.
Examples
The following example represents an organizational hierarchy. It demonstrates how a variable length edge could be used to find employees of different levels of the hierarchy in a single query. The nodes in the graph represent employees and the edges are from an employee to their manager. After we build the graph using make-graph, we search for employees in Alice’s organization that are younger than 30.
let employees = datatable(name:string, age:long)
[
  "Alice", 32,
  "Bob", 31,
  "Eve", 27,
  "Joe", 29,
  "Chris", 45,
  "Alex", 35,
  "Ben", 23,
  "Richard", 39,
];
let reports = datatable(employee:string, manager:string)
[
  "Bob", "Alice",
  "Chris", "Alice",
  "Eve", "Bob",
  "Ben", "Chris",
  "Joe", "Alice",
  "Richard", "Bob"
];
reports
| make-graph employee --> manager with employees on name
| graph-match (alice)<-[reports*1..5]-(employee)
  where alice.name == "Alice" and employee.age < 30
  project employee = employee.name, age = employee.age, reportingPath = map(reports, manager)
Output
| employee | age | reportingPath |
|---|---|---|
| Joe | 29 | [ “Alice” ] |
| Eve | 27 | [ “Alice”, “Bob” ] |
| Ben | 23 | [ “Alice”, “Chris” ] |
The following example builds a graph from the Actions and Entities tables. The entities are people and systems, and the actions describe different relations between entities. Following the make-graph operator that builds the graph is a call to graph-match with a graph pattern that searches for attack paths to the "Apollo" system.
let Entities = datatable(name:string, type:string, age:long)
[
  "Alice", "Person", 23,
  "Bob", "Person", 31,
  "Eve", "Person", 17,
  "Mallory", "Person", 29,
  "Apollo", "System", 99
];
let Actions = datatable(source:string, destination:string, action_type:string)
[
  "Alice", "Bob", "communicatesWith",
  "Alice", "Apollo", "trusts",
  "Bob", "Apollo", "hasPermission",
  "Eve", "Alice", "attacks",
  "Mallory", "Alice", "attacks",
  "Mallory", "Bob", "attacks"
];
Actions
| make-graph source --> destination with Entities on name
| graph-match (mallory)-[attacks]->(compromised)-[hasPermission]->(apollo)
  where mallory.name == "Mallory" and apollo.name == "Apollo" and attacks.action_type == "attacks" and hasPermission.action_type == "hasPermission"
  project Attacker = mallory.name, Compromised = compromised.name, System = apollo.name
Output
| Attacker | Compromised | System |
|---|---|---|
| Mallory | Bob | Apollo |
The following example is similar to the previous attack path example, but with an extra constraint: we want the compromised entity to also communicate with Alice. The graph-match pattern prefix is the same as the previous example and we add another sequence with the compromised as a link between the sequences.
let Entities = datatable(name:string, type:string, age:long)
[
  "Alice", "Person", 23,
  "Bob", "Person", 31,
  "Eve", "Person", 17,
  "Mallory", "Person", 29,
  "Apollo", "System", 99
];
let Actions = datatable(source:string, destination:string, action_type:string)
[
  "Alice", "Bob", "communicatesWith",
  "Alice", "Apollo", "trusts",
  "Bob", "Apollo", "hasPermission",
  "Eve", "Alice", "attacks",
  "Mallory", "Alice", "attacks",
  "Mallory", "Bob", "attacks"
];
Actions
| make-graph source --> destination with Entities on name
| graph-match (mallory)-[attacks]->(compromised)-[hasPermission]->(apollo), (compromised)-[communicates]-(alice)
  where mallory.name == "Mallory" and apollo.name == "Apollo" and attacks.action_type == "attacks" and hasPermission.action_type == "hasPermission" and alice.name == "Alice"
  project Attacker = mallory.name, Compromised = compromised.name, System = apollo.name
Output
| Attacker | Compromised | System |
|---|---|---|
| Mallory | Bob | Apollo |
Related content
4 - graph-shortest-paths Operator (preview)
The graph-shortest-paths operator finds the shortest paths between a set of source nodes and a set of target nodes in a graph and returns a table with the results.
Syntax
G | graph-shortest-paths [output = OutputOption] Pattern where Predicate project [ColumnName =] Expression [, …]
Parameters
| Name | Type | Required | Description |
|---|---|---|---|
| G | string | ✔️ | The graph source, typically the output from a make-graph operation. |
| Pattern | string | ✔️ | A path pattern that describes the path to find. Patterns must include at least one variable length edge and can’t contain multiple sequences. |
| Predicate | expression | A boolean expression that consists of properties of named variables in the pattern and constants. | |
| Expression | expression | ✔️ | A scalar expression that defines the output row for each found path, using constants and references to properties of named variables in the pattern. |
| OutputOption | string | Specifies the search output as any (default) or all. Output is specified as any for a single shortest path per source/target pair and all for all shortest paths of equal minimum length. |
Path pattern notation
The following table shows the supported path pattern notations.
| Element | Named variable | Anonymous element |
|---|---|---|
| Node | (n) | () |
| Directed edge from left to right | -[e]-> | --> |
| Directed edge from right to left | <-[e]- | <-- |
| Any direction edge | -[e]- | -- |
| Variable length edge | -[e*3..5]- | -[*3..5]- |
Variable length edge
A variable length edge allows a specific pattern to repeat multiple times within defined limits. An asterisk (*) denotes this type of edge, followed by the minimum and maximum occurrence values in the format min..max. These values must be integer scalars. Any sequence of edges within this range can match the variable edge of the pattern, provided all the edges in the sequence meet the where clause constraints.
Returns
The graph-shortest-paths operator returns a tabular result, where each record corresponds to a path found in the graph. The returned columns are defined in the operator’s project clause using properties of nodes and edges defined in the pattern. Properties and functions of properties of variable length edges, are returned as a dynamic array. Each value in the array corresponds to an occurrence of the variable length edge.
Examples
The following example demonstrates how to use the graph-shortest-paths operator to find the shortest path between two stations in a transportation network. The query constructs a graph from the data in connections and finds the shortest path from the "South-West" to the "North" station, considering paths up to five connections long. Since the default output is any, it finds any shortest path.
let connections = datatable(from_station:string, to_station:string, line:string)
[
  "Central", "North", "red",
  "North", "Central", "red",
  "Central", "South",  "red",
  "South", "Central",  "red",
  "South", "South-West", "red",
  "South-West", "South", "red",
  "South-West", "West", "red",
  "West", "South-West", "red",
  "Central", "East", "blue",
  "East", "Central", "blue",
  "Central", "West", "blue",
  "West", "Central", "blue",
];
connections
| make-graph from_station --> to_station with_node_id=station
| graph-shortest-paths (start)-[connections*1..5]->(destination)
  where start.station == "South-West" and destination.station == "North"
  project from = start.station, path = map(connections, to_station), line = map(connections, line), to = destination.station
Output
| from | path | line | to |
|---|---|---|---|
| South-West | [ “South”, “Central”, “North” ] | [ “red”, “red”, “red” ] | North |
The following example, like the previous example, finds the shortest paths in a transportation network. However, it uses output=all, so returns all shortest paths.
let connections = datatable(from_station:string, to_station:string, line:string)
[
  "Central", "North", "red",
  "North", "Central", "red",
  "Central", "South",  "red",
  "South", "Central",  "red",
  "South", "South-West", "red",
  "South-West", "South", "red",
  "South-West", "West", "red",
  "West", "South-West", "red",
  "Central", "East", "blue",
  "East", "Central", "blue",
  "Central", "West", "blue",
  "West", "Central", "blue",
];
connections
| make-graph from_station --> to_station with_node_id=station
| graph-shortest-paths output=all (start)-[connections*1..5]->(destination)
  where start.station == "South-West" and destination.station == "North"
  project from = start.station, path = map(connections, to_station), line = map(connections, line), to = destination.station
Output
| from | path | line | to |
|---|---|---|---|
| South-West | [ “South”, “Central”, “North” ] | [ “red”, “red”, “red” ] | North |
| South-West | [ “West”, “Central”, “North” ] | [ “red”, “blue”, “red” ] | North |
Related content
5 - graph-to-table operator
The graph-to-table operator exports nodes or edges from a graph to tables.
Syntax
Nodes
G | graph-to-table nodes [ with_node_id=ColumnName ]
Edges
G | graph-to-table edges [ with_source_id=ColumnName ] [ with_target_id=ColumnName ] [ as TableName ]
Nodes and edges
G | graph-to-table nodes as NodesTableName [ with_node_id=ColumnName ], edges as EdgesTableName [ with_source_id=ColumnName ] [ with_target_id=ColumnName ]
Parameters
| Name | Type | Required | Description |
|---|---|---|---|
| G | string | ✔️ | The input graph source. |
| NodesTableName | string | The name of the exported nodes table. | |
| EdgesTableName | string | The name of the exported edges table. | |
| ColumnName | string | Export the node hash ID, source node hash ID, or target node hash ID with the given column name. |
Returns
Nodes
The graph-to-table operator returns a tabular result, in which each row corresponds to a node in the source graph. The returned columns are the node’s properties. When with_node_id is provided, the node hash column is of long type.
Edges
The graph-to-table operator returns a tabular result, in which each row corresponds to an edge in the source graph. The returned columns are the node’s properties. When with_source_id or with_target_id are provided, the node hash column is of long type.
Nodes and edges
The graph-to-table operator returns two tabular results, matching the previous descriptions.
Examples
The following example denonstrates how the graph-to-table operator exports the edges from a graph to a table. The with_source_id and with_target_id parameters export the node hash for source and target nodes of each edge.
let nodes = datatable(name:string, type:string, age:long)
[
	"Alice", "Person", 23,
	"Bob", "Person", 31,
	"Eve", "Person", 17,
	"Mallory", "Person", 29,
	"Trent", "System", 99
];
let edges = datatable(source:string, destination:string, edge_type:string)
[
	"Alice", "Bob", "communicatesWith",
	"Alice", "Trent", "trusts",
	"Bob", "Trent", "hasPermission",
	"Eve", "Alice", "attacks",
	"Mallory", "Alice", "attacks",
	"Mallory", "Bob", "attacks"
];
edges
| make-graph source --> destination with nodes on name
| graph-to-table edges with_source_id=SourceId with_target_id=TargetId
Output
| SourceId | TargetId | source | destination | edge_type |
|---|---|---|---|---|
| -3122868243544336885 | -7133945255344544237 | Alice | Bob | communicatesWith |
| -3122868243544336885 | 2533909231875758225 | Alice | Trent | trusts |
| -7133945255344544237 | 2533909231875758225 | Bob | Trent | hasPermission |
| 4363395278938690453 | -3122868243544336885 | Eve | Alice | attacks |
| 3855580634910899594 | -3122868243544336885 | Mallory | Alice | attacks |
| 3855580634910899594 | -7133945255344544237 | Mallory | Bob | attacks |
Get nodes
The following example shows how the graph-to-table operator exports the nodes from a graph to a table. The with_node_id parameter exports the node hash.
let nodes = datatable(name:string, type:string, age:long)
[
	"Alice", "Person", 23,
	"Bob", "Person", 31,
	"Eve", "Person", 17,
	"Trent", "System", 99
];
let edges = datatable(source:string, destination:string, edge_type:string)
[
	"Alice", "Bob", "communicatesWith",
	"Alice", "Trent", "trusts",
	"Bob", "Trent", "hasPermission",
	"Eve", "Alice", "attacks",
	"Mallory", "Alice", "attacks",
	"Mallory", "Bob", "attacks"
];
edges
| make-graph source --> destination with nodes on name
| graph-to-table nodes with_node_id=NodeId
Output
| NodeId | name | type | age |
|---|---|---|---|
| -3122868243544336885 | Alice | Person | 23 |
| -7133945255344544237 | Bob | Person | 31 |
| 4363395278938690453 | Eve | Person | 17 |
| 2533909231875758225 | Trent | System | 99 |
| 3855580634910899594 | Mallory |
The following example uses the graph-to-table operator to export the nodes and edges from a graph to a table.
let nodes = datatable(name:string, type:string, age:long)
[
	"Alice", "Person", 23,
	"Bob", "Person", 31,
	"Eve", "Person", 17,
	"Trent", "System", 99
];
let edges = datatable(source:string, destination:string, edge_type:string)
[
	"Alice", "Bob", "communicatesWith",
	"Alice", "Trent", "trusts",
	"Bob", "Trent", "hasPermission",
	"Eve", "Alice", "attacks",
	"Mallory", "Alice", "attacks",
	"Mallory", "Bob", "attacks"
];
edges
| make-graph source --> destination with nodes on name
| graph-to-table nodes as N with_node_id=NodeId, edges as E with_source_id=SourceId;
N;
E
Output table 1
| NodeId | name | type | age |
|---|---|---|---|
| -3122868243544336885 | Alice | Person | 23 |
| -7133945255344544237 | Bob | Person | 31 |
| 4363395278938690453 | Eve | Person | 17 |
| 2533909231875758225 | Trent | System | 99 |
| 3855580634910899594 | Mallory |
Output table 2
| SourceId | source | destination | edge_type |
|---|---|---|---|
| -3122868243544336885 | Alice | Bob | communicatesWith |
| -3122868243544336885 | Alice | Trent | trusts |
| -7133945255344544237 | Bob | Trent | hasPermission |
| 4363395278938690453 | Eve | Alice | attacks |
| 3855580634910899594 | Mallory | Alice | attacks |
| 3855580634910899594 | Mallory | Bob | attacks |
Related content
6 - make-graph operator
The make-graph operator builds a graph structure from tabular inputs of edges and nodes.
Syntax
Edges | make-graph SourceNodeId --> TargetNodeId [ with Nodes1 on NodeId1 [, Nodes2 on NodeId2 ]]
Edges | make-graph SourceNodeId --> TargetNodeId [ with_node_id= NodeIdPropertyName ]
Edges | make-graph SourceNodeId --> TargetNodeId [ with Nodes1 on NodeId1 [, Nodes2 on NodeId2 ]] partitioned-by PartitionColumn ( GraphOperator )
Parameters
| Name | Type | Required | Description |
|---|---|---|---|
| Edges | string | ✔️ | The tabular source containing the edges of the graph, each row represents an edge in the graph. |
| SourceNodeId | string | ✔️ | The column in Edges with the source node IDs of the edges. |
| TargetNodeId | string | ✔️ | The column in Edges with the target node IDs of the edges. |
| Nodes1, Nodes2 | string | The tabular expressions containing the properties of the nodes in the graph. | |
| NodesId1, NodesId2 | string | The corresponding columns with the node IDs in Nodes1, Nodes2 respectively. | |
| NodeIdPropertyName | string | The name of the property for node ID on the nodes of the graph. | |
| PartitionColumn | string | The column to partition the graph by. Creates separate graphs for each unique value in this column. | |
| GraphOperator | string | The graph operator to apply to each partitioned graph. |
Returns
The make-graph operator returns a graph expression and must be followed by a graph operator. Each row in the source Edges expression becomes an edge in the graph with properties that are the column values of the row. Each row in the Nodes tabular expression becomes a node in the graph with properties that are the column values of the row. Nodes that appear in the Edges table but don’t have a corresponding row in the Nodes table are created as nodes with the corresponding node ID and empty properties.
When using the partitioned-by clause, separate graphs are created for each unique value in the specified PartitionColumn. The specified GraphOperator is then applied to each partitioned graph independently, and the results are combined into a single output. This is particularly useful for multitenant scenarios where you want to analyze each tenant’s data separately while maintaining the same graph structure and analysis logic.
Users can handle node information in the following ways:
- No node information required:
make-graphcompletes with source and target. - Explicit node properties: use up to two tabular expressions using “
withNodes1onNodeId1 [,Nodes2onNodeId2 ].” - Default node identifier: use “
with_node_id=DefaultNodeId.”
Example
Edges and nodes graph
The following example builds a graph from edges and nodes tables. The nodes represent people and systems, and the edges represent different relationships between nodes. The make-graph operator builds the graph. Then, the graph-match operator is used with a graph pattern to search for attack paths leading to the "Trent" system node.
let nodes = datatable(name:string, type:string, age:int)
[
  "Alice", "Person", 23,
  "Bob", "Person", 31,
  "Eve", "Person", 17,
  "Mallory", "Person", 29,
  "Trent", "System", 99
];
let edges = datatable(Source:string, Destination:string, edge_type:string)
[
  "Alice", "Bob", "communicatesWith",
  "Alice", "Trent", "trusts",
  "Bob", "Trent", "hasPermission",
  "Eve", "Alice", "attacks",
  "Mallory", "Alice", "attacks",
  "Mallory", "Bob", "attacks"
];
edges
| make-graph Source --> Destination with nodes on name
| graph-match (mallory)-[attacks]->(compromised)-[hasPermission]->(trent)
  where mallory.name == "Mallory" and trent.name == "Trent" and attacks.edge_type == "attacks" and hasPermission.edge_type == "hasPermission"
  project Attacker = mallory.name, Compromised = compromised.name, System = trent.name
Output
| Attacker | Compromised | System |
|---|---|---|
| Mallory | Bob | Trent |
Default node identifier
The following example builds a graph using only edges, with the name property as the default node identifier. This approach is useful when creating a graph from a tabular expression of edges, ensuring that the node identifier is available for the constraints section of the subsequent graph-match operator.
let edges = datatable(source:string, destination:string, edge_type:string)
[
  "Alice", "Bob", "communicatesWith",
  "Alice", "Trent", "trusts",
  "Bob", "Trent", "hasPermission",
  "Eve", "Alice", "attacks",
  "Mallory", "Alice", "attacks",
  "Mallory", "Bob", "attacks"
];
edges
| make-graph source --> destination with_node_id=name
| graph-match (mallory)-[attacks]->(compromised)-[hasPermission]->(trent)
  where mallory.name == "Mallory" and trent.name == "Trent" and attacks.edge_type == "attacks" and hasPermission.edge_type == "hasPermission"
  project Attacker = mallory.name, Compromised = compromised.name, System = trent.name
Output
| Attacker | Compromised | System |
|---|---|---|
| Mallory | Bob | Trent |
Partitioned graph
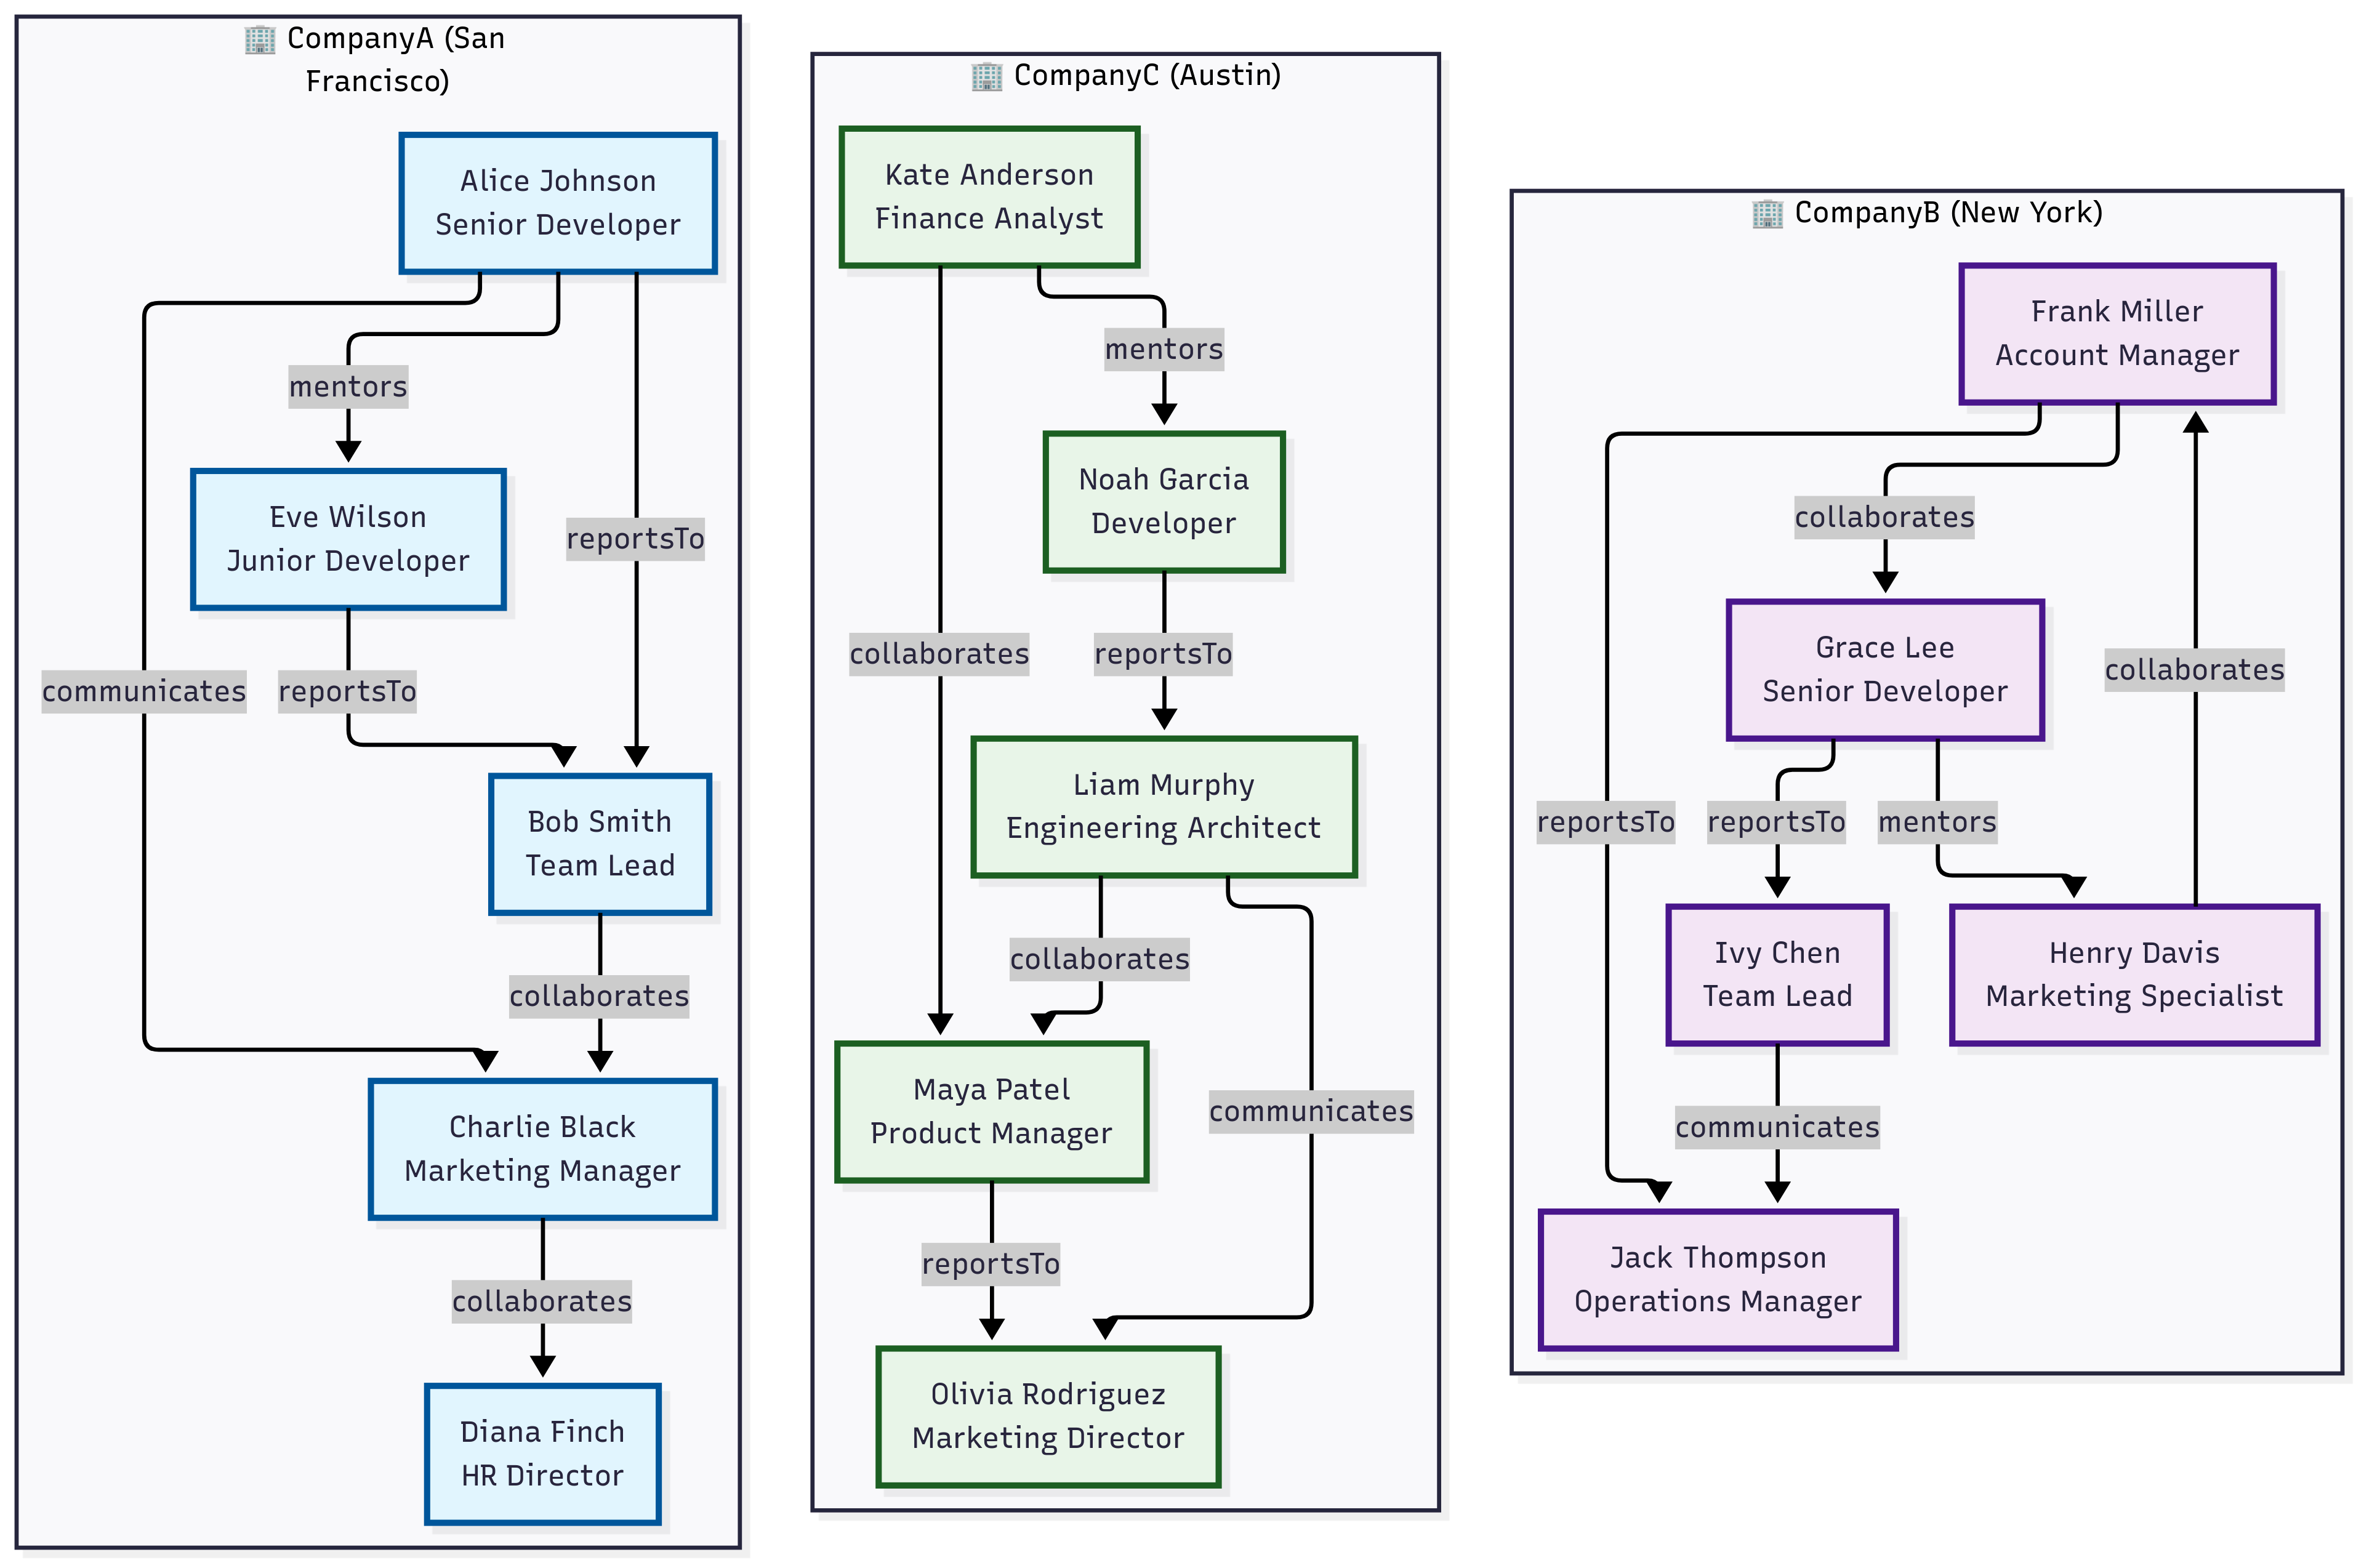
This example demonstrates using the partitioned-by clause to analyze a multitenant social network. The partitioned-by clause creates separate graphs for each unique value in the partition column (in this case, tenantId), applies the graph operator to each partition independently, and combines the results.
// Nodes table representing users across multiple tenants (organizations)
let nodes = datatable(userId:string, tenantId:string, name:string, department:string, role:string, location:dynamic)
[
    // Tenant: CompanyA - San Francisco Bay Area
    "u001", "CompanyA", "Alice Johnson", "Engineering", "Senior Developer", dynamic({"type": "Point", "coordinates": [-122.4194, 37.7749]}),
    "u002", "CompanyA", "Bob Smith", "Engineering", "Team Lead", dynamic({"type": "Point", "coordinates": [-122.4094, 37.7849]}),
    "u003", "CompanyA", "Charlie Black", "Marketing", "Manager", dynamic({"type": "Point", "coordinates": [-122.4294, 37.7649]}),
    "u004", "CompanyA", "Diana Finch", "HR", "Director", dynamic({"type": "Point", "coordinates": [-122.3994, 37.7949]}),
    "u005", "CompanyA", "Eve Wilson", "Engineering", "Junior Developer", dynamic({"type": "Point", "coordinates": [-122.4394, 37.7549]}),
    // Tenant: CompanyB - New York Area
    "u006", "CompanyB", "Frank Miller", "Sales", "Account Manager", dynamic({"type": "Point", "coordinates": [-74.0060, 40.7128]}),
    "u007", "CompanyB", "Grace Lee", "Engineering", "Senior Developer", dynamic({"type": "Point", "coordinates": [-74.0160, 40.7228]}),
    "u008", "CompanyB", "Henry Davis", "Marketing", "Specialist", dynamic({"type": "Point", "coordinates": [-73.9960, 40.7028]}),
    "u009", "CompanyB", "Ivy Chen", "Engineering", "Team Lead", dynamic({"type": "Point", "coordinates": [-74.0260, 40.7328]}),
    "u010", "CompanyB", "Jack Thompson", "Operations", "Manager", dynamic({"type": "Point", "coordinates": [-73.9860, 40.6928]}),
    // Tenant: CompanyC - Austin Area
    "u011", "CompanyC", "Kate Anderson", "Finance", "Analyst", dynamic({"type": "Point", "coordinates": [-97.7431, 30.2672]}),
    "u012", "CompanyC", "Liam Murphy", "Engineering", "Architect", dynamic({"type": "Point", "coordinates": [-97.7331, 30.2772]}),
    "u013", "CompanyC", "Maya Patel", "Product", "Manager", dynamic({"type": "Point", "coordinates": [-97.7531, 30.2572]}),
    "u014", "CompanyC", "Noah Garcia", "Engineering", "Developer", dynamic({"type": "Point", "coordinates": [-97.7631, 30.2472]}),
    "u015", "CompanyC", "Olivia Rodriguez", "Marketing", "Director", dynamic({"type": "Point", "coordinates": [-97.7231, 30.2872]})
];
// Edges table representing relationships/interactions between users
let edges = datatable(sourceUserId:string, targetUserId:string, tenantId:string, relationshipType:string, strength:int)
[
    // CompanyA relationships
    "u001", "u002", "CompanyA", "reportsTo", 9,
    "u005", "u002", "CompanyA", "reportsTo", 8,
    "u002", "u003", "CompanyA", "collaborates", 6,
    "u001", "u005", "CompanyA", "mentors", 7,
    "u003", "u004", "CompanyA", "collaborates", 5,
    "u001", "u003", "CompanyA", "communicates", 4,
    // CompanyB relationships
    "u007", "u009", "CompanyB", "reportsTo", 9,
    "u006", "u010", "CompanyB", "reportsTo", 8,
    "u008", "u006", "CompanyB", "collaborates", 6,
    "u009", "u010", "CompanyB", "communicates", 5,
    "u007", "u008", "CompanyB", "mentors", 7,
    "u006", "u007", "CompanyB", "collaborates", 6,
    // CompanyC relationships
    "u014", "u012", "CompanyC", "reportsTo", 9,
    "u012", "u013", "CompanyC", "collaborates", 7,
    "u011", "u013", "CompanyC", "collaborates", 6,
    "u013", "u015", "CompanyC", "reportsTo", 8,
    "u012", "u015", "CompanyC", "communicates", 5,
    "u011", "u014", "CompanyC", "mentors", 6
];
edges
| make-graph sourceUserId --> targetUserId with nodes on userId partitioned-by tenantId (
    graph-match cycles=none (n1)-[e*2..4]->(n2)
        where n1.userId != n2.userId and all(e, relationshipType == "collaborates") and
            geo_distance_2points(todouble(n1.location.coordinates[0]), todouble(n1.location.coordinates[1]),
                             todouble(n2.location.coordinates[0]), todouble(n2.location.coordinates[1])) < 10000
        project Start = strcat(n1.name, " (", n1.tenantId, ")"), Tenants = map(e, tenantId), End = strcat(n2.name, " (", n2.tenantId, ")")
)
| Start | Tenants | End |
|---|---|---|
| Bob Smith (CompanyA) | [ “CompanyA”, “CompanyA” ] | Diana Finch (CompanyA) |
| Henry Davis (CompanyB) | [ “CompanyB”, “CompanyB” ] | Grace Lee (CompanyB) |