This is the multi-page printable view of this section. Click here to print.
Data reshaping plugins
1 - bag_unpack plugin
The bag_unpack plugin unpacks a single column of type dynamic, by treating each property bag top-level slot as a column. The plugin is invoked with the evaluate operator.
Syntax
T | evaluate bag_unpack( Column [, OutputColumnPrefix ] [, columnsConflict ] [, ignoredProperties ] ) [: OutputSchema]
Parameters
| Name | Type | Required | Description |
|---|---|---|---|
| T | string | ✔️ | The tabular input whose column Column is to be unpacked. |
| Column | dynamic | ✔️ | The column of T to unpack. |
| OutputColumnPrefix | string | A common prefix to add to all columns produced by the plugin. | |
| columnsConflict | string | The direction for column conflict resolution. Valid values:error - Query produces an error (default)replace_source - Source column is replacedkeep_source - Source column is kept | |
| ignoredProperties | dynamic | An optional set of bag properties to be ignored. } | |
| OutputSchema | Specify the column names and types for the bag_unpack plugin output. For syntax information, see Output schema syntax, and to understand the implications, see Performance considerations. |
Output schema syntax
( ColumnName : ColumnType [, …] )
Use a wildcard * as the first parameter to include all columns of the source table in the output, as follows:
( * , ColumnName : ColumnType [, …] )
Performance considerations
Using the plugin without an OutputSchema can have severe performance implications in large datasets and should be avoided.
Providing an OutputSchema allows the query engine to optimize the query execution, as it can determine the output schema without needing to parse and analyze the input data. OutputSchema is beneficial when the input data is large or complex. See the Examples with performance implications of using the plugin with and without a defined OutputSchema.
Returns
The bag_unpack plugin returns a table with as many records as its tabular input (T). The schema of the table is the same as the schema of its tabular input with the following modifications:
- The specified input column (Column) is removed.
- The name of each column corresponds to the name of each slot, optionally prefixed by OutputColumnPrefix.
- The type of each column is either the type of the slot, if all values of the same slot have the same type, or
dynamic, if the values differ in type. - The schema is extended with as many columns as there are distinct slots in the top-level property bag values of T.
Tabular schema rules apply to the input data. In particular:
- An output column name can’t be the same as an existing column in the tabular input T, unless it’s the column to unpack (Column). Otherwise, the output includes two columns with the same name.
- All slot names, when prefixed by OutputColumnPrefix, must be valid entity names and follow the identifier naming rules.
The plugin ignores null values.
Examples
The examples in this section show how to use the syntax to help you get started.
Expand a bag:
datatable(d:dynamic)
[
    dynamic({"Name": "John", "Age":20}),
    dynamic({"Name": "Dave", "Age":40}),
    dynamic({"Name": "Jasmine", "Age":30}),
]
| evaluate bag_unpack(d)
Output
Age | Name |
|---|---|
| 20 | John |
| 40 | Dave |
| 30 | Jasmine |
Expand a bag and use the OutputColumnPrefix option to produce column names with a prefix:
datatable(d:dynamic)
[
    dynamic({"Name": "John", "Age":20}),
    dynamic({"Name": "Dave", "Age":40}),
    dynamic({"Name": "Jasmine", "Age":30}),
]
| evaluate bag_unpack(d, 'Property_')
Output
Property_Age | Property_Name |
|---|---|
| 20 | John |
| 40 | Dave |
| 30 | Jasmine |
Expand a bag and use the columnsConflict option to resolve a column conflict between the dynamic column and the existing column:
datatable(Name:string, d:dynamic)
[
    'James', dynamic({"Name": "John", "Age":20}),
    'David', dynamic({ "Age":40}),
    'Emily', dynamic({"Name": "Jasmine", "Age":30}),
]
| evaluate bag_unpack(d, columnsConflict='replace_source') // Replace old column Name by new column
Output
Name | Age |
|---|---|
| John | 20 |
| 40 | |
| Jasmine | 30 |
datatable(Name:string, d:dynamic)
[
    'James', dynamic({"Name": "John", "Age":20}),
    'David', dynamic({"Name": "Dave", "Age":40}),
    'Emily', dynamic({"Name": "Jasmine", "Age":30}),
]
| evaluate bag_unpack(d, columnsConflict='keep_source') // Keep old column Name
Output
Name | Age |
|---|---|
| James | 20 |
| David | 40 |
| Emily | 30 |
Expand a bag and use the ignoredProperties option to ignore 2 of the properties in the property bag:
datatable(d:dynamic)
[
    dynamic({"Name": "John", "Age":20, "Address": "Address-1" }),
    dynamic({"Name": "Dave", "Age":40, "Address": "Address-2"}),
    dynamic({"Name": "Jasmine", "Age":30, "Address": "Address-3"}),
]
// Ignore 'Age' and 'Address' properties
| evaluate bag_unpack(d, ignoredProperties=dynamic(['Address', 'Age']))
Output
Name |
|---|
| John |
| Dave |
| Jasmine |
Expand a bag and use the OutputSchema option:
datatable(d:dynamic)
[
    dynamic({"Name": "John", "Age":20}),
    dynamic({ "Name": "Dave", "Height": 170, "Age":40}),
    dynamic({"Name": "Jasmine", "Age":30}),
]
| evaluate bag_unpack(d)
Output
Age | Height | Name |
|---|---|---|
| 20 | John | |
| 40 | 170 | Dave |
| 30 | Jasmine |
Expand a bag with an OutputSchema and use the wildcard * option:
This query returns the original slot Description and the columns defined in the OutputSchema.
datatable(d:dynamic, Description: string)
[
    dynamic({"Name": "John", "Age":20, "height":180}), "Student",
    dynamic({"Name": "Dave", "Age":40, "height":160}), "Teacher",
    dynamic({"Name": "Jasmine", "Age":30, "height":172}), "Student",
]
| evaluate bag_unpack(d) : (*, Name:string, Age:long)
Output
| Description | Name | Age |
|---|---|---|
| Student | John | 20 |
| Teacher | Dave | 40 |
| Student | Jasmine | 30 |
Examples with performance implications
Expand a bag with and without a defined OutputSchema to compare performance implications:
This example uses a publicly available table in the help cluster. In the ContosoSales database, there’s a table called SalesDynamic. The table contains sales data and includes a dynamic column named Customer_Properties.
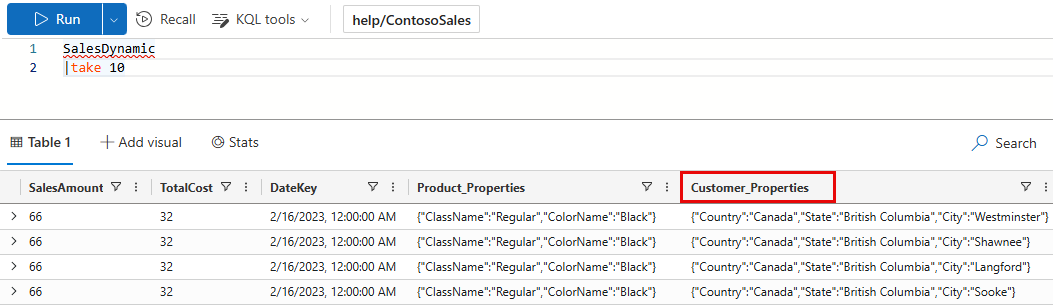
Example with no output schema: The first query doesn’t define an OutputSchema. The query takes 5.84 seconds of CPU and scans 36.39 MB of data.
[!div class=“nextstepaction”] Run the query
SalesDynamic
| evaluate bag_unpack(Customer_Properties)
| summarize Sales=sum(SalesAmount) by Country, State
Example with output schema: The second query does provide an OutputSchema. The query takes 0.45 seconds of CPU and scans 19.31 MB of data. The query doesn’t have to analyze the input table, saving on processing time.
[!div class=“nextstepaction”] Run the query
SalesDynamic
| evaluate bag_unpack(Customer_Properties) :  (*, Country:string, State:string, City:string)
| summarize Sales=sum(SalesAmount) by Country, State
Output
The output is the same for both queries. The first 10 rows of the output are shown below.
Country/Region | State | Sales |
|---|---|---|
| Canada | British Columbia | 56,101,083 |
| United Kingdom | England | 77,288,747 |
| Australia | Victoria | 31,242,423 |
| Australia | Queensland | 27,617,822 |
| Australia | South Australia | 8,530,537 |
| Australia | New South Wales | 54,765,786 |
| Australia | Tasmania | 3,704,648 |
| Canada | Alberta | 375,061 |
| Canada | Ontario | 38,282 |
| United States | Washington | 80,544,870 |
| … | … | … |
Related content
2 - narrow plugin
The narrow plugin “unpivots” a wide table into a table with three columns:
- Row number
- Column type
- Column value (as
string)
The narrow plugin is designed mainly for display purposes, as it allows wide
tables to be displayed comfortably without the need of horizontal scrolling.
The plugin is invoked with the evaluate operator.
Syntax
T | evaluate narrow()
Examples
The following example shows an easy way to read the output of the Kusto
.show diagnostics management command.
.show diagnostics
 | evaluate narrow()
The results of .show diagnostics itself is a table with a single row and
33 columns. By using the narrow plugin we “rotate” the output to something
like this:
| Row | Column | Value |
|---|---|---|
| 0 | IsHealthy | True |
| 0 | IsRebalanceRequired | False |
| 0 | IsScaleOutRequired | False |
| 0 | MachinesTotal | 2 |
| 0 | MachinesOffline | 0 |
| 0 | NodeLastRestartedOn | 2017-03-14 10:59:18.9263023 |
| 0 | AdminLastElectedOn | 2017-03-14 10:58:41.6741934 |
| 0 | ClusterWarmDataCapacityFactor | 0.130552847673333 |
| 0 | ExtentsTotal | 136 |
| 0 | DiskColdAllocationPercentage | 5 |
| 0 | InstancesTargetBasedOnDataCapacity | 2 |
| 0 | TotalOriginalDataSize | 5167628070 |
| 0 | TotalExtentSize | 1779165230 |
| 0 | IngestionsLoadFactor | 0 |
| 0 | IngestionsInProgress | 0 |
| 0 | IngestionsSuccessRate | 100 |
| 0 | MergesInProgress | 0 |
| 0 | BuildVersion | 1.0.6281.19882 |
| 0 | BuildTime | 2017-03-13 11:02:44.0000000 |
| 0 | ClusterDataCapacityFactor | 0.130552847673333 |
| 0 | IsDataWarmingRequired | False |
| 0 | RebalanceLastRunOn | 2017-03-21 09:14:53.8523455 |
| 0 | DataWarmingLastRunOn | 2017-03-21 09:19:54.1438800 |
| 0 | MergesSuccessRate | 100 |
| 0 | NotHealthyReason | [null] |
| 0 | IsAttentionRequired | False |
| 0 | AttentionRequiredReason | [null] |
| 0 | ProductVersion | KustoRelease_2017.03.13.2 |
| 0 | FailedIngestOperations | 0 |
| 0 | FailedMergeOperations | 0 |
| 0 | MaxExtentsInSingleTable | 64 |
| 0 | TableWithMaxExtents | KustoMonitoringPersistentDatabase.KustoMonitoringTable |
| 0 | WarmExtentSize | 1779165230 |
3 - pivot plugin
Rotates a table by turning the unique values from one column in the input table into multiple columns in the output table and performs aggregations as required on any remaining column values that will appear in the final output.
Syntax
T | evaluate pivot(pivotColumn[, aggregationFunction] [,column1 [,column2 … ]]) [: OutputSchema]
Parameters
| Name | Type | Required | Description |
|---|---|---|---|
| pivotColumn | string | ✔️ | The column to rotate. Each unique value from this column will be a column in the output table. |
| aggregationFunction | string | An aggregation function used to aggregate multiple rows in the input table to a single row in the output table. Currently supported functions: min(), max(), take_any(), sum(), dcount(), avg(), stdev(), variance(), make_list(), make_bag(), make_set(), count(). The default is count(). | |
| column1, column2, … | string | A column name or comma-separated list of column names. The output table will contain an additional column per each specified column. The default is all columns other than the pivoted column and the aggregation column. | |
| OutputSchema | The names and types for the expected columns of the pivot plugin output.Syntax: ( ColumnName : ColumnType [, …] )Specifying the expected schema optimizes query execution by not having to first run the actual query to explore the schema. An error is raised if the run-time schema doesn’t match the OutputSchema schema. |
Returns
Pivot returns the rotated table with specified columns (column1, column2, …) plus all unique values of the pivot columns. Each cell for the pivoted columns will contain the aggregate function computation.
Examples
Pivot by a column
For each EventType and State starting with ‘AL’, count the number of events of this type in this state.
StormEvents
| project State, EventType
| where State startswith "AL"
| where EventType has "Wind"
| evaluate pivot(State)
Output
| EventType | ALABAMA | ALASKA |
|---|---|---|
| Thunderstorm Wind | 352 | 1 |
| High Wind | 0 | 95 |
| Extreme Cold/Wind Chill | 0 | 10 |
| Strong Wind | 22 | 0 |
Pivot by a column with aggregation function
For each EventType and State starting with ‘AR’, display the total number of direct deaths.
StormEvents
| where State startswith "AR"
| project State, EventType, DeathsDirect
| where DeathsDirect > 0
| evaluate pivot(State, sum(DeathsDirect))
Output
| EventType | ARKANSAS | ARIZONA |
|---|---|---|
| Heavy Rain | 1 | 0 |
| Thunderstorm Wind | 1 | 0 |
| Lightning | 0 | 1 |
| Flash Flood | 0 | 6 |
| Strong Wind | 1 | 0 |
| Heat | 3 | 0 |
Pivot by a column with aggregation function and a single additional column
Result is identical to previous example.
StormEvents
| where State startswith "AR"
| project State, EventType, DeathsDirect
| where DeathsDirect > 0
| evaluate pivot(State, sum(DeathsDirect), EventType)
Output
| EventType | ARKANSAS | ARIZONA |
|---|---|---|
| Heavy Rain | 1 | 0 |
| Thunderstorm Wind | 1 | 0 |
| Lightning | 0 | 1 |
| Flash Flood | 0 | 6 |
| Strong Wind | 1 | 0 |
| Heat | 3 | 0 |
Specify the pivoted column, aggregation function, and multiple additional columns
For each event type, source, and state, sum the number of direct deaths.
StormEvents
| where State startswith "AR"
| where DeathsDirect > 0
| evaluate pivot(State, sum(DeathsDirect), EventType, Source)
Output
| EventType | Source | ARKANSAS | ARIZONA |
|---|---|---|---|
| Heavy Rain | Emergency Manager | 1 | 0 |
| Thunderstorm Wind | Emergency Manager | 1 | 0 |
| Lightning | Newspaper | 0 | 1 |
| Flash Flood | Trained Spotter | 0 | 2 |
| Flash Flood | Broadcast Media | 0 | 3 |
| Flash Flood | Newspaper | 0 | 1 |
| Strong Wind | Law Enforcement | 1 | 0 |
| Heat | Newspaper | 3 | 0 |
Pivot with a query-defined output schema
The following example selects specific columns in the StormEvents table. It uses an explicit schema definition that allows various optimizations to be evaluated before running the actual query.
StormEvents
| project State, EventType
| where EventType has "Wind"
| evaluate pivot(State): (EventType:string, ALABAMA:long, ALASKA:long)
Output
| EventType | ALABAMA | ALASKA |
|---|---|---|
| Thunderstorm Wind | 352 | 1 |
| High Wind | 0 | 95 |
| Marine Thunderstorm Wind | 0 | 0 |
| Strong Wind | 22 | 0 |
| Extreme Cold/Wind Chill | 0 | 10 |
| Cold/Wind Chill | 0 | 0 |
| Marine Strong Wind | 0 | 0 |
| Marine High Wind | 0 | 0 |