Stacked area chart visualization
The stacked area chart visual shows a continuous relationship. This visual is similar to the Area chart, but shows the area under each element of a series. The first column of the query should be numeric and is used as the x-axis. Other numeric columns are the y-axes. Unlike line charts, area charts also visually represent volume. Area charts are ideal for indicating the change among different datasets.
Syntax
T | render stackedareachart [with (propertyName = propertyValue [, …])]
Supported parameters
| Name | Type | Required | Description |
|---|---|---|---|
| T | string | ✔️ | Input table name. |
| propertyName, propertyValue | string | A comma-separated list of key-value property pairs. See supported properties. |
Supported properties
All properties are optional.
| PropertyName | PropertyValue |
|---|---|
accumulate | Whether the value of each measure gets added to all its predecessors. (true or false) |
legend | Whether to display a legend or not (visible or hidden). |
series | Comma-delimited list of columns whose combined per-record values define the series that record belongs to. |
ymin | The minimum value to be displayed on Y-axis. |
ymax | The maximum value to be displayed on Y-axis. |
title | The title of the visualization (of type string). |
xaxis | How to scale the x-axis (linear or log). |
xcolumn | Which column in the result is used for the x-axis. |
xtitle | The title of the x-axis (of type string). |
yaxis | How to scale the y-axis (linear or log). |
ycolumns | Comma-delimited list of columns that consist of the values provided per value of the x column. |
ytitle | The title of the y-axis (of type string). |
Example
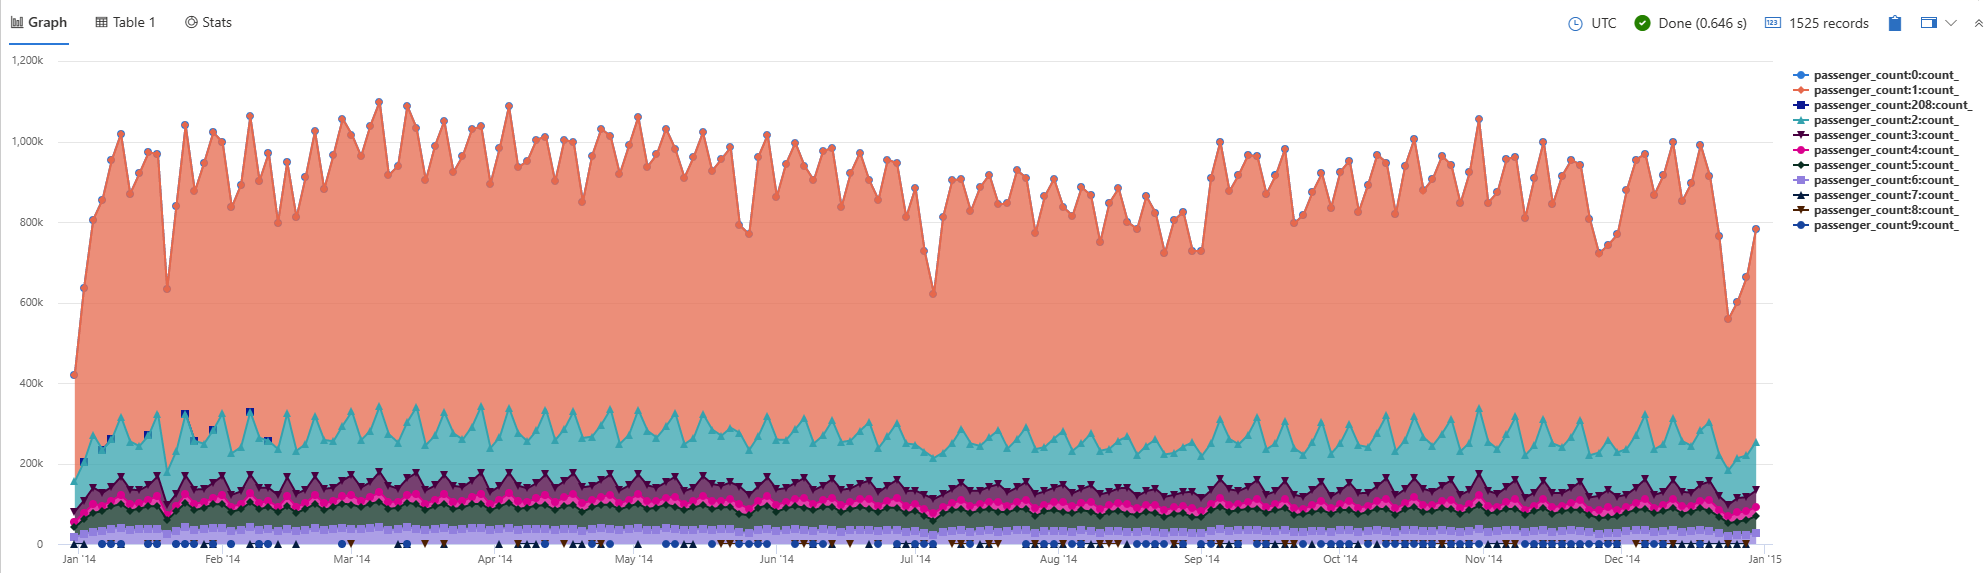
The following query summarizes data from the nyc_taxi table by number of passengers and visualizes the data in a stacked area chart. The x-axis shows the pickup time in two day intervals, and the stacked areas represent different passenger counts.
nyc_taxi
| summarize count() by passenger_count, bin(pickup_datetime, 2d)
| render stackedareachart with (xcolumn=pickup_datetime, series=passenger_count)
Output
Related content
Feedback
Was this page helpful?
Glad to hear it! Please tell us how we can improve.
Sorry to hear that. Please tell us how we can improve.