Time pivot visualization
The time pivot visualization is an interactive navigation over the events time-line pivoting on time axis.
Syntax
T | render timepivot [with (propertyName = propertyValue [, …])]
Parameters
| Name | Type | Required | Description |
|---|---|---|---|
| T | string | ✔️ | Input table name. |
| propertyName, propertyValue | string | A comma-separated list of key-value property pairs. See supported properties. |
Supported properties
All properties are optional.
| PropertyName | PropertyValue |
|---|---|
series | Comma-delimited list of columns whose combined per-record values define the series that record belongs to. |
Interactive display
After you render the time pivot, you can further investigate and interact with the data by adding slice levels, and by drilling into specific time slices. The data in the table updates interactively according to the slice options you configure. The slice options that are available are:
- Change, add, and remove multiple slice levels
- Expand rows to view details of each level
- Toggle to view by start time or by end time
- Select specific rows, or specific time slices, and view their data in the table.
Examples
The examples in this section show how to use the syntax to help you get started.
Visualize flood events per state
This query outputs a visualization of flood events in the specified Midwestern states, displayed as a time pivot chart.
let midwesternStates = dynamic([
  "ILLINOIS", "INDIANA", "IOWA", "KANSAS", "MICHIGAN", "MINNESOTA",
  "MISSOURI", "NEBRASKA", "NORTH DAKOTA", "OHIO", "SOUTH DAKOTA", "WISCONSIN"
]);
StormEvents
| where EventType == "Flood" and State in (midwesternStates)
| render timepivot with (series=State)
Output
:::image type=“content” source=“media/visualization-timepivot/time-pivot-visualization.jpg” lightbox=“media/visualization-timepivot/time-pivot-visualization.jpg” alt-text=“Screenshot of time pivot in Kusto.Explorer.”:::
You can further interact with the time pivot, for example:
Select a new slice option to change the data displayed in the time pivot. The data in the table below the time pivot updates to reflect the new series.
:::image type=“content” source=“media/visualization-timepivot/time-pivot-slice-options.png” lightbox=“media/visualization-timepivot/time-pivot-slice-options.png” alt-text=“Screenshot of time pivot slice options in Kusto.Explorer.”:::
Add slice option levels to further investigate and interact with the data. Expand each row to see the levels added.
:::image type=“content” source=“media/visualization-timepivot/time-pivot-add-levels.png” lightbox=“media/visualization-timepivot/time-pivot-add-levels.png” alt-text=“Screenshot of time pivot with multiple levels expanded in Kusto.Explorer.”:::
To display the data relevant for a specific slice, select one or more time slices in a row of the time pivot.
:::image type=“content” source=“media/visualization-timepivot/time-pivot-slice-specific.png” lightbox=“media/visualization-timepivot/time-pivot-slice-specific.png” alt-text=“Screenshot of specific time slicein Kusto.Explorer.”:::
View and slice hierarchical OpenTelemetry data
OpenTelemetry data slice options reflect its nested hierarchy.
In this example, a time pivot is rendered according to a specific TraceID in the datatable. The query shown in this example contains the first two rows of data from a large table.
datatable(TraceID:string, SpanID:string, ParentID:string, SpanName:string, SpanStatus:string, SpanKind:string, StartTime:datetime, EndTime:datetime, ResourceAttributes:dynamic, TraceAttributes:dynamic, Events:dynamic, Links:dynamic)
[
    "c339bbae48eb8426f9a63c4eee55284c", "d1265cecd4c291ee", "", "POST", "STATUS_CODE_UNSET", "SPAN_KIND_CLIENT", datetime(2025-04-07T04:15:52.1657810Z), datetime(2025-04-07T04:16:01.6616919Z), dynamic({"k8s.namespace.name":"otel-demo","k8s.pod.start_time":"2025-04-06T00:19:47.0000000Z","k8s.deployment.name":"opentelemetry-demo-loadgenerator","k8s.node.name":"aks-userpool-31567306-vmss000003","service.name":"loadgenerator","service.version":"1.12.0","k8s.pod.uid":"d2fbaf5d-b5c2-4dac-af08-b92d56573899","k8s.pod.name":"opentelemetry-demo-loadgenerator-6994f5db8-lq4qs","service.instance.id":"d2fbaf5d-b5c2-4dac-af08-b92d56573899","service.namespace":"opentelemetry-demo","k8s.pod.ip":"10.244.0.57","telemetry.sdk.language":"python","telemetry.sdk.version":"1.25.0","telemetry.sdk.name":"opentelemetry"}), dynamic({"http.status_code":200,"http.url":"http://opentelemetry-demo-frontendproxy:8080/api/checkout","http.method":"POST","scope.name":"opentelemetry.instrumentation.requests","scope.version":"0.46b0"}), dynamic([]), dynamic([]),
    "c339bbae48eb8426f9a63c4eee55284c", "651aa53d2f583eca", "d488b4a32f60794f", "POST /api/checkout", "STATUS_CODE_UNSET", "SPAN_KIND_SERVER", datetime(2025-04-07T04:15:52.1680000Z), datetime(2025-04-07T04:16:01.4667420Z), dynamic({"k8s.namespace.name":"otel-demo","k8s.pod.start_time":"2025-04-06T00:19:47.0000000Z","k8s.deployment.name":"opentelemetry-demo-frontend","k8s.node.name":"aks-userpool-31567306-vmss000003","service.name":"frontend","service.version":"1.12.0","k8s.pod.uid":"b61b8875-b9ec-4144-b866-df88b8c6c67c","k8s.pod.name":"opentelemetry-demo-frontend-59bccd8fdb-j9xxf","service.instance.id":"b61b8875-b9ec-4144-b866-df88b8c6c67c","service.namespace":"opentelemetry-demo","k8s.pod.ip":"10.244.0.45","process.command_args":["/usr/local/bin/node","--require","./Instrumentation.js","/app/server.js"],"os.type":"linux","telemetry.sdk.language":"nodejs","telemetry.sdk.version":"1.25.1","process.pid":16,"telemetry.sdk.name":"opentelemetry","process.runtime.name":"nodejs","process.runtime.description":"Node.js","process.runtime.version":"20.18.0","host.name":"opentelemetry-demo-frontend-59bccd8fdb-j9xxf","host.arch":"amd64","process.executable.path":"/usr/local/bin/node","container.id":"d1763eedd13fa94f9581d9099ab481e112a8fdf95b6da831b9f01a4b8490fe60","os.version":"5.15.176.3-3.cm2","process.owner":"nextjs","process.command":"/app/server.js","process.executable.name":"node"}), dynamic({"http.status_code":200,"http.method":"POST","scope.name":"next.js","scope.version":"0.0.1","http.target":"/api/checkout","next.span_type":"BaseServer.handleRequest","next.span_name":"POST /api/checkout","next.rsc":false}), dynamic([]), dynamic([]),
    ...
]
| where TraceID == '081a007d3b7deaf32ca43a554c5058bd'
| render timepivot
Output
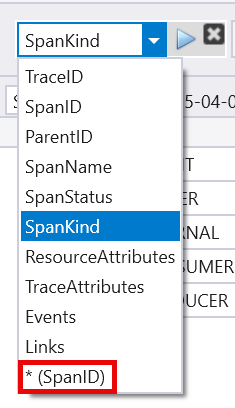
In the time pivot, the Slice options are automatically set to SpanKind as the column to pivot by.
:::image type=“content” source=“media/visualization-timepivot/telemetry-spankind.png” lightbox=“media/visualization-timepivot/telemetry-spankind.png” alt-text=“Screenshot of the time pivot rendered with an OpenTelemetry data source.”:::
You can show the hierarchy of the individual spans in the same OpenTelemetry trace, by changing the Slice options to (SpanID). The hierarchy is expandable to display the spans that make up the entire trace. For each span you can see the span kind, span name, and span ID as the span header.
The header in the first line is [SPAN_KIND_CLIENT/POST]: 3275d2b91035ce2e and is expanded to show the hierarchy.
:::image type=“content” source=“media/visualization-timepivot/telemetry-time-pivot.png” lightbox=“media/visualization-timepivot/telemetry-time-pivot.png” alt-text=“Screenshot of the time pivot with expanded heirarchy.”:::
Feedback
Was this page helpful?
Glad to hear it! Please tell us how we can improve.
Sorry to hear that. Please tell us how we can improve.