series_outliers()
Learn how to use the series_outliers() function to score anomaly points in a series.
Scores anomaly points in a series.
The function takes an expression with a dynamic numerical array as input, and generates a dynamic numeric array of the same length. Each value of the array indicates a score of a possible anomaly, using “Tukey’s test”. A value greater than 1.5 in the same element of the input indicates a rise anomaly. A value less than -1.5 indicates a decline anomaly.
Syntax
series_outliers(series [, kind ] [, ignore_val ] [, min_percentile ] [, max_percentile ])
Parameters
| Name | Type | Required | Description |
|---|---|---|---|
| series | dynamic | ✔️ | An array of numeric values. |
| kind | string | The algorithm to use for outlier detection. The supported options are "tukey", which is traditional “Tukey”, and "ctukey", which is custom “Tukey”. The default is "ctukey". | |
| ignore_val | int, long, or real | A numeric value indicating the missing values in the series. The default is double(null). The score of nulls and ignore values is set to 0. | |
| min_percentile | int, long, or real | The minimum percentile to use to calculate the normal inter-quantile range. The default is 10. The value must be in the range [2.0, 98.0]. This parameter is only relevant for the "ctukey" kind. | |
| max_percentile | int, long, or real | The maximum percentile to use to calculate the normal inter-quantile range. The default is 90. The value must be in the range [2.0, 98.0]. This parameter is only relevant for the "ctukey" kind. |
The following table describes differences between "tukey" and "ctukey":
| Algorithm | Default quantile range | Supports custom quantile range |
|---|---|---|
"tukey" | 25% / 75% | No |
"ctukey" | 10% / 90% | Yes |
Example
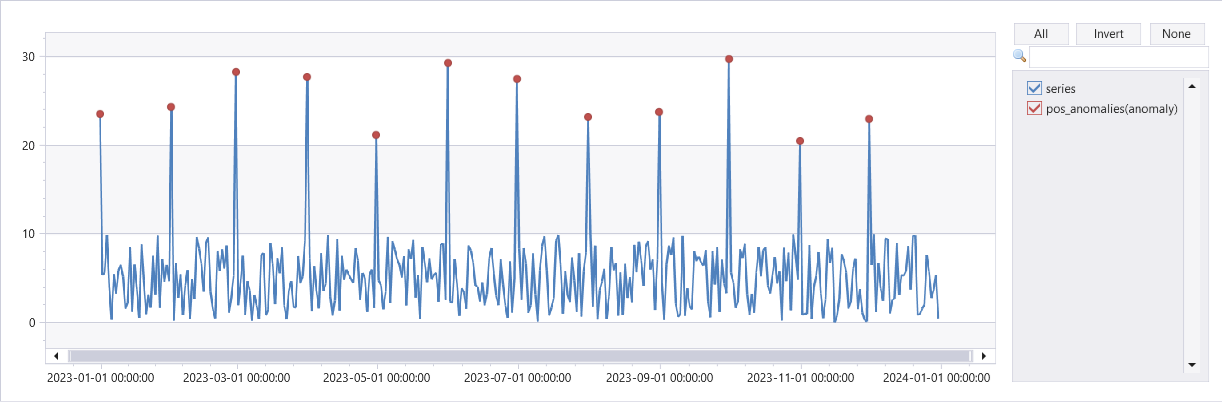
range x from 0 to 364 step 1
| extend t = datetime(2023-01-01) + 1d*x
| extend y = rand() * 10
| extend y = iff(monthofyear(t) != monthofyear(prev(t)), y+20, y) // generate a sample series with outliers at first day of each month
| summarize t = make_list(t), series = make_list(y)
| extend outliers=series_outliers(series)
| extend pos_anomalies = array_iff(series_greater_equals(outliers, 1.5), 1, 0)
| render anomalychart with(xcolumn=t, ycolumns=series, anomalycolumns=pos_anomalies)
Feedback
Was this page helpful?
Glad to hear it! Please tell us how we can improve.
Sorry to hear that. Please tell us how we can improve.